Remodel Math: What Actually Pays You Back When You Sell a Bay Area Home
You are holding a contractor quote and asking the only question that matters: does any of this money come back when we sell?
I teach this to my clients with a single dataset, and I am going to show you the whole thing. Zonda Media publishes the Cost vs. Value Report through Remodeling magazine every year, comparing what common projects cost against what they return at resale. The numbers below are the 2025 edition for the San Francisco metro, which is our metro. Fremont, Newark and Union City sit inside the San Francisco, Oakland and Fremont statistical area, so this is not national data waved at California. It is the closest published mirror of the Tri-City market that exists.
One honesty note before the chart, because I would rather bore you than mislead you. The report changed how it measures costs in recent editions, so a 2025 percentage cannot be compared to an older one, and every figure is an average across a whole metro for professionally installed work. Use these numbers to rank projects against each other. Never treat them as a quote or a promise for your house.
All twenty projects, ranked by what comes back
All twenty projects, 2025 San Francisco metro
exterior interior tap a row for the dollars
Source: 2025 Cost vs. Value Report, Zonda Media / Remodeling. San Francisco metro, Pacific region and national data as published at jlconline.com. © 2025 Zonda Media, a Delaware corporation. Percentages are averages for professionally installed projects across a whole metro, and the report's methodology changed between editions, so treat every figure as a planning signal with a year stamp, never a promise for any specific house.
Sit with that chart for a minute, because the pattern is the entire lesson.
The market pays for the outside of your house
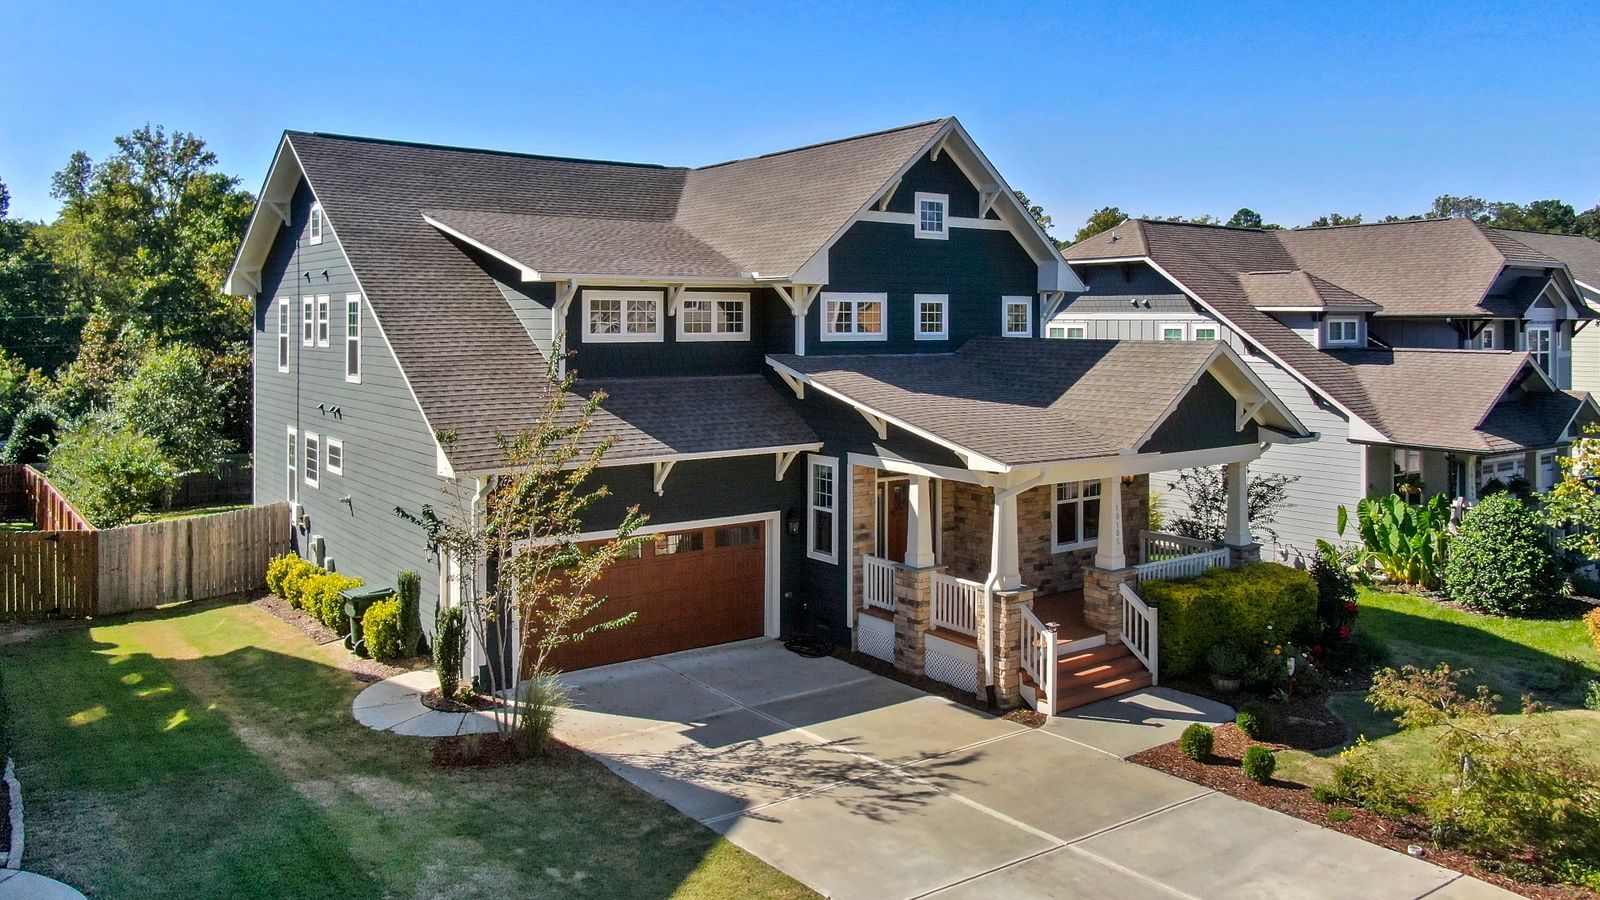
Every project that clears its own cost in our metro is something a buyer sees from the sidewalk or in the first listing photo. A steel entry door returns 237.2 percent of its cost on the 2025 metro average. A garage door returns 236.7 percent. Stone veneer returns 226.5 percent. Fiber cement siding and a minor kitchen refresh hover just above breakeven.
Now look at the bottom. A midrange primary suite addition returns 25.8 percent. An upscale kitchen returns 32.1 percent. An upscale bath returns 35.1 percent. These are the projects people assume add value, and they are the worst performers on the entire board.
The reason is not mysterious. Buyers shop with their eyes first, and the exterior is the handshake. Interior remodels, meanwhile, get repriced through the buyer's taste. The more expensive and more personal the finish, the bigger the mental discount. Your dream kitchen is, statistically, somebody else's renovation project.
The thirty thousand dollar cliff
Flip the chart to the dollars view and a second pattern appears. Almost everything that costs less than about thirty thousand dollars keeps most of its value or better. Almost everything above that line sheds tens of thousands. The single worst gap on the board is the upscale primary suite addition, where the 2025 metro average shows roughly 361,767 dollars of a 424,200 dollar project never coming back.
That cliff is the practical takeaway. Small money spent on the shell of the house is defensible spending. Big money spent inside is a lifestyle purchase. Both can be right. Only one of them should be called an investment.
Decide by timeline, not by catalog
So what should you actually do? Answer one question first: how long will you own this house?
Selling within a year or two. Spend small and spend outside. Door, garage door, paint, landscape refresh, and whatever an agent walkthrough flags as objection removal. Then put your energy into pricing, because pricing strategy moves more money than any remodel.
Staying five to ten years. Buy the projects that make the house yours, but do it with open eyes. Divide the unrecovered cost by the years you will use the space and decide whether that number is worth it to your family. It often is. Just do not book it as equity.
Not sure. This is where a fifteen minute conversation earns its keep. I do pre listing walkthroughs constantly, and the list I hand a seller is usually shorter and cheaper than the one they feared.
Which projects fit your budget and your timeline?
- 1Manufactured stone veneer 227%returns $28,093 on $12,403 spent, the metro average says it carries itself.
- 2Fiber cement siding 110%returns $26,573 on $24,197 spent, the metro average says it carries itself.
- 3Wood deck addition 92%returns about $18,425 of $20,059 at resale, budget the $1,634 difference consciously.
- 4Vinyl window replacement 85%returns about $21,138 of $24,996 at resale, budget the $3,858 difference consciously.
- 5Wood window replacement 82%returns about $23,872 of $29,188 at resale, budget the $5,316 difference consciously.
The whole series, one project at a time
I wrote a full breakdown of every project on this board, each with its own chart, its own quote checker, and the local wrinkles that national data cannot see, from Title 24 windows to wildfire zone siding rules.
The curb appeal money makers: garage door, steel entry door, stone veneer, fiberglass grand entrance
The shell of the house: fiber cement siding, vinyl siding, vinyl windows, wood windows, asphalt shingle roof, metal roof
Outdoor living: wood deck, composite deck
The live-in remodels: minor kitchen, midrange kitchen, midrange bath, universal design bath
The big money, eyes open: upscale kitchen, upscale bath, primary suite addition, bathroom addition
If you are weighing any of these against a sale date, I will tell you plainly which ones your house needs and which ones it does not. That conversation is free and it routinely saves people five figures.
Harv Balu, REALTOR®
- Cell / Text: (510) 600-3425
- Email: homes@HarvRealtor.com
- Web: HarvRealtor.com
- REALTY EXPERTS®, 41051 Mission Blvd, Fremont, CA 94539, DRE# 02195792
Disclosures
This information is educational and general in nature and is not a bid, valuation, appraisal, or guarantee of any outcome. Cost and resale figures are published averages from the Zonda Media and Remodeling magazine Cost vs. Value Report, cited by edition year and geography in the text, current as of August 2026. The report's methodology changed between editions, so figures from different years are not comparable. Building code, energy code and permit notes describe general California practice and vary by city; verify current requirements with your local building department before contracting any work. Consult licensed contractors for bids and licensed professionals for tax questions. Equal Housing Opportunity. Information deemed reliable but not guaranteed.
Questions sellers ask me about remodeling before a sale
Should I remodel my house before selling it in the Bay Area?
Usually not in the way people imagine. The 2025 Cost vs. Value data for the San Francisco metro shows that only a handful of projects, almost all of them exterior and almost all of them under about thirty thousand dollars, return as much as they cost. Big interior remodels return a fraction of the spend. Before you commit to anything, have an agent walk the house and tell you which two or three items actually move your sale price on your street. Paint, light prep and correct pricing routinely beat a six figure remodel on net proceeds.
What home improvement has the highest return on investment in 2026?
In the 2025 Cost vs. Value Report, the top recoup percentages in the San Francisco metro belong to a steel entry door at 237.2 percent, a garage door replacement at 236.7 percent, and manufactured stone veneer at 226.5 percent. All three are exterior, all three are modest checks, and all three work by transforming the first photo a buyer sees. Those percentages are metro averages from one published report, not a promise for any specific house, and the report's methodology changed in recent editions, so use them for ranking projects rather than forecasting dollars.
Why do kitchen and bathroom remodels have such a low resale return?
Because you buy the remodel at retail and sell it at the buyer's taste. A major midrange kitchen in the San Francisco metro cost about 97,667 dollars in the 2025 report and returned about 47,360 dollars at resale, roughly 48 percent. Buyers reprice your choices the moment they walk in, and anything they would have done differently gets mentally deducted. Kitchens and baths absolutely help homes sell faster, but they are comfort purchases you enjoy while you live there, not investments that pay you back at the closing table.

Harv Balu
REALTOR® | GRI, CIPS, PSA, FTBS · REALTY EXPERTS®
CA DRE# 02195792
Read every post in HarvRealtor, my free app, and the words read offline. Download it free from the App Store® (opens in new tab).