Newark Real Estate Market Report, September 2026: The Median Fell, and Months of Supply Hit a Five-Year High
Newark's median sale price fell in September 2026. The median single-family home closed at $1,298,000, down 11.4% from August's $1,465,000. Read on its own, that sounds like a sharp drop in what Newark homes are worth.
The rest of the report tells a different story on price. In the same month, the median price per square foot on closed sales rose 15.4% to $817, ending a three-month slide. The homes that sold went quickly and at about asking: 100.97% of list on average, after a median of 13 days on market. The bigger change was on the supply side. Active listings jumped 26.5% to 62, new contracts fell 24% to 19, and months of supply climbed to 2.82, the highest point on the report's five-year chart.
Here is the complete picture, recreated from the Bay East Association of REALTORS® and RPR market-trends data for Newark as a whole, with a free branded PDF you can download and keep at the end.
September 2026 at a glance
Newark, CA, Single Family Residence, citywide. Median sold price $1,298,000, Sold-to-list 100.97%, Median 13 days on market, 2.82 months of inventory, 25 closed sales, Median estimated value $1,348,730
The interactive dashboard below walks through every number: the median sold price, the months-of-supply dial, how price and value moved apart, the full metric grid, and this month's supply and demand by stage.
The Newark market in September 2026
Single Family Residence, citywide Newark. Not condos or townhomes.
All figures from the Bay East Association of REALTORS® / RPR market-trends report, data through September 2026.
Months of supply hit a five-year high
Newark carried 2.82 months of supply in September, still well under the six-month mark that typically signals a balanced market. But it is up 32.4% from August and 44.6% higher than a year ago, the highest point on the report's five-year chart. Active listings rose to 62 while new contracts fell to 19, so homes came on faster than buyers committed. The homes that did sell went quickly and at about asking: they averaged 100.97% of list after a median of 13 days on market. Sellers keep the structural edge, but supply has not been this high relative to new contracts in five years.
Why the median fell while price per foot rose
Three figures from the same report, each shown as its change from August.
The median most likely fell because of which homes sold, not because the same home got 11.4% cheaper.
The median price per foot rose 15.4%, ending a three-month slide, and the model value of the typical home barely moved. Smaller homes closing is the likely reason for the drop, the mirror image of August. The report does not break out home size, so this is a reading of the figures, not a measurement.
The full market profile
The six price tiles share one $0 to $2M scale, so the bars compare directly. The two price per foot tiles carry a decorative rule, not a scaled bar.
How many homes, how many buyers
The month's pipeline by stage. Every count is exact from the report; the free PDF adds five-year context bands for price, price per foot, sold to list and months of supply.
Forty-one homes came on and 62 sat active at month end, while 25 closed and 19 more went into contract. Closings rose 8.7% from August, but new contracts fell 24% and active inventory jumped 26.5%, so listings piled up faster than buyers committed. Months of inventory landed at 2.82, up 32.4% from August and 44.6% from a year ago.
The median fell and price per foot rebounded, August's story in reverse
The median sold price fell to $1,298,000, down 11.4% from August. Read on its own, that sounds like Newark prices sliding.
The median sold price per square foot rose to $817, up 15.4%. Read on its own, that sounds like the opposite.
Both are correct, and last month's Newark report showed the same split pointing the other way. The median sold price reports the middle sale of the month, so it moves whenever the kind of home selling changes. Smaller homes usually sell for less in total but more per square foot. A month in which more of them close tends to pull the median down and push the median price per foot up at the same time, which is exactly September's pattern. The most likely explanation is that September's closings skewed toward smaller homes. The report does not break out home size, so that is a reading of the figures, not a measurement.
A third number from the same report points the same way. RPR's median estimated value for Newark single-family homes was $1,348,730, down 0.8% from August and down 2.4% from a year ago. That is a model estimate, not an appraisal, but it covers Newark's single-family homes as a whole rather than only the 25 that happened to close, and it barely moved. September's median close landed about $51,000 below that estimate. In August, the median close sat about $105,000 above it.
Last month I flagged that price per foot had fallen three months running: $874 in June, $793 in July and $708 in August. September's $817 breaks that streak. One higher month does not make a trend, especially on 25 sales, but the slide did not continue.
On the report's five-year chart, September's $1,298,000 is the lowest monthly median since June 2025. With price per foot up and the model value nearly flat, I read it as a month in which smaller homes closed, not an 11.4% drop in what a given Newark home is worth.
This is why I never quote one month's median as the value of your home. It describes what sold, not what yours is worth.
The homes that sold went fast, and at about asking
The homes that closed in September had spent a median of 13 days on market before going under contract, down 48% from August. They closed at 100.97% of list price on average, up from 99.4% in August. On the report's chart, August was the only month of the past year to average under asking, and September is back above it. That is an average across 25 closed sales, so it does not mean every home sold over list.
The contracts written during September came together quickly too. The homes that went into contract during the month did it in a median of 14 days, down 26.3% from August.
The homes that did not sell are sitting longer. The homes still active at month end had been listed a median of 27 days, up 17.4%, and there were 62 of them, up 26.5%. Newark is selling at two speeds. In my experience, the homes that are priced and presented well are the ones going in about two weeks at about asking, while the rest join a growing list of homes still waiting. The report itself does not measure pricing or condition.
Escrow usually runs about a month, so many of the homes that closed in September went into contract in August. The closed figures lean toward August's contracts, and the new-contract figures describe September's.
Listings piled up while new contracts fell
The pipeline tells its own story this month:
- 41 new listings came on the market, up 5.1% from August
- 62 homes were active at the end of the month, up 26.5%
- 19 homes went into contract during September, down 24%
- 23 homes were pending at month end, down 17.9%
- 25 homes closed, up 8.7%
Closings rose, but with escrow usually running about a month, that likely reflects contracts signed in August. The forward-looking numbers moved the other way: fewer buyers committed in September, and the pool of active homes grew by 13. Fewer new contracts now usually means fewer closings in the month or two ahead.
One more detail cuts both ways. The homes still in contract at month end carry a median list price of $1,515,000, up 8.8%, well above September's $1,298,000 closed median. But the homes that went into contract during September carry a median list price of $1,295,000, right at that closed median. Both are list prices on small counts, so neither says where closed prices go next.
Months of supply climbed to its highest point in five years
Months of inventory finished September at 2.82, up 32.4% from August and up 44.6% from September 2025. On the report's five-year chart, from September 2021 through September 2026, that is the highest point, just above a revised June 2026 reading of about 2.78.
One note on that comparison. Last month's report published August at 2.23 months of supply, and RPR has since revised August as later records arrived. This report's 32.4% rise implies a revised August of about 2.13 months, and the report's own chart shows the same. RPR also revised August's new contracts from 24 to 25, its month-end pendings from 27 to 28, the closed sales' median days on market from 27 to 25, and the new contracts' median days from 18 to 19, along with the median list prices of new and month-end pendings (to about $1,360,000 and $1,392,500). August's closed prices and sales count did not change. Every change in this post is measured against RPR's revised August, not the figures first published.

Photo by Alfred Twu, CC0, via Wikimedia Commons.
That still leaves Newark inside seller's territory, and RPR's own market-type gauge for September reads seller's market. The long-standing convention holds that roughly six months of supply marks a balanced market, and 2.82 months is well short of it. What has changed is the margin. Measured against its average pace of new contracts over the last twelve months, Newark has not carried this much supply at any point in the last five years.
A year ago, Newark had fewer homes for sale and more buyers signing
Set against September 2025, read from the report's five-year charts:
- Active listings: 62 at the end of September, against about 43 a year earlier
- New contracts: 19 during September, against about 29 a year earlier
- Closed sales: 25, against about 37
- New listings: 41, against about 40, close to flat
- Sold to list price: 100.97% on average, against about 103.3%
- Median days on market for closed sales: 13, against about 9
Two things built the inventory, on two time scales. Over the past twelve months, sellers listed about 20% more homes than in the twelve months before, roughly 420 against 350, while new contracts kept almost exactly the same pace, roughly 265 against 260. That is why months of supply is up 44.6% on the year: more sellers, not fewer buyers. September then added a push of its own. New listings matched a year ago, but about ten fewer homes went into contract, so active listings rose by 13 in the month, where a year earlier they held flat. Prices have eased with it. September's median close was about 4% below September 2025's roughly $1.35 million, and RPR's estimate of the typical Newark home is down 2.4% over the year.
The year-ago figures and the twelve-month totals are approximate, read from the plotted series. The current figures, and the 44.6% and 2.4% year-over-year changes, are exact from the report.
In the five-year view, the median sits low and months of supply sits at the top
Context matters more than any single month. Measured against the plotted five-year trend in the source report, from September 2021 through September 2026:
- Median sold price has ranged from roughly $1,085,000 to $1,846,000. The top of that range is a single thin month, January 2024, with only a handful of sales. September's $1,298,000 is the lowest monthly median on the chart since June 2025.
- Sold price per square foot has ranged from roughly $686 to $1,007. September's $817 sits in the lower half, up from August's $708 near the bottom.
- Sold to list price has ranged from roughly 96.5% to 117.8%. September's 100.97% is near the low end, and far below the bidding-war highs of early 2022.
- Months of supply has ranged from roughly 0.35 to 2.82, and September is the top of that range.
Those band edges are approximate, read from the plotted five-year series in the source report. Each current value is exact.
What this means if you are selling in Newark
Price it right on day one. The homes that went into contract in September did it in a median of 14 days. That first stretch is when every active buyer with a saved search sees your home for the first time. In my experience, a list price above what comparable homes are going into contract at spends that window, and in a month with 62 homes for sale, a home that misses it has plenty of company. I laid out why in the overpricing trap.
Expect more competition from other sellers. Active listings ended September at 62, up 26.5% in a month, and months of supply, measured against new contracts, is at its five-year high. Buyers have more homes to compare yours against, so price and presentation both matter more.
Your number comes from your street, not the median. A $1,298,000 citywide median that fell 11.4% on 25 sales is not a value for your home, any more than August's $1,465,000 was. The homes that sold near you, at your size and condition, are.
What this means if you are buying in Newark
Months of supply is at its five-year high. At 2.82 months of supply, Newark is still a seller's market on paper, but new contracts fell 24% and the homes still active at month end had been listed a median of 27 days. On the homes that have been sitting, there may be room to negotiate. The report does not track repairs or terms, but in a month like this they are worth raising too.
The homes that do sell still go fast. The homes that closed in September averaged 100.97% of list after a median of 13 days on market. If a home is priced in line with its neighbors and shows well, expect other buyers to notice it too, and be ready to move.
First-time buyers, watch the city's new program. Newark has set aside $3 million for first-time buyer down payment loans of up to $200,000, depending on household income. As of October 6, 2026, the program had not opened. I explain how it is set up to work in what Newark's mayor told local agents.
Rates are part of the math. The Fed moved on September 16, and I walked through what the Fed's first rate hike since 2023 means for Bay Area buyers, including what it did and did not do to mortgage rates.
For more on Newark itself, from Old Town to the neighborhoods around Lakeshore Park, see my Newark city guide.
Thinking about a move in Newark?
A market report tells the story of the whole city. To know what it means for your specific home or your next purchase, let's talk. I will put together a true, address-specific opinion of value based on the homes actually selling near you, with no pressure and no obligation. Call or text me at (510) 600-3425, or email homes@HarvRealtor.com.
Harv Balu, REALTOR®
- Cell / Text: (510) 600-3425
- Email: homes@HarvRealtor.com
- Web: HarvRealtor.com
- REALTY EXPERTS® · 41051 Mission Blvd, Fremont, CA 94539 · DRE #02195792
---
Disclosures & Disclaimers
Based on information from the Bay East Association of REALTORS® and Realtors Property Resource® (RPR®) market-trends report for Newark, California, Single Family Residence, citywide, generated October 6, 2026 (its pages carry RPR's October 7, 2026 date stamp), with data through September 2026. All figures describe the Newark single-family market as a whole at every size and condition, not condominiums or townhomes, and not any individual property. Properties may or may not be listed by the office or agent presenting this information.
Figures are deemed reliable but not guaranteed, are subject to revision by the source, and are not a prediction of future value. RPR revises prior months as late data arrives, so the August baselines inside this report can differ from the figures the August report published; every month-over-month change here is the one this report calculated, and the revised August figures quoted above are implied by those changes and match the report's own charts. The June, July and August price per foot figures are the ones those months' own reports published. Year-ago figures, five-year ranges, and every comparison with earlier months on the five-year chart are approximate, read from the plotted trend charts in the source report; each current value, and each year-over-year change the report prints, is exact. The median estimated value is an automated model estimate, not a formal appraisal. Nothing here is an appraisal or a valuation of any specific property. Harv Balu, REALTOR®, is a California real estate licensee (DRE #02195792), not a lender, attorney, or CPA, and does not provide legal, tax, or lending advice. This is not intended as a solicitation if your property is currently listed with another broker.
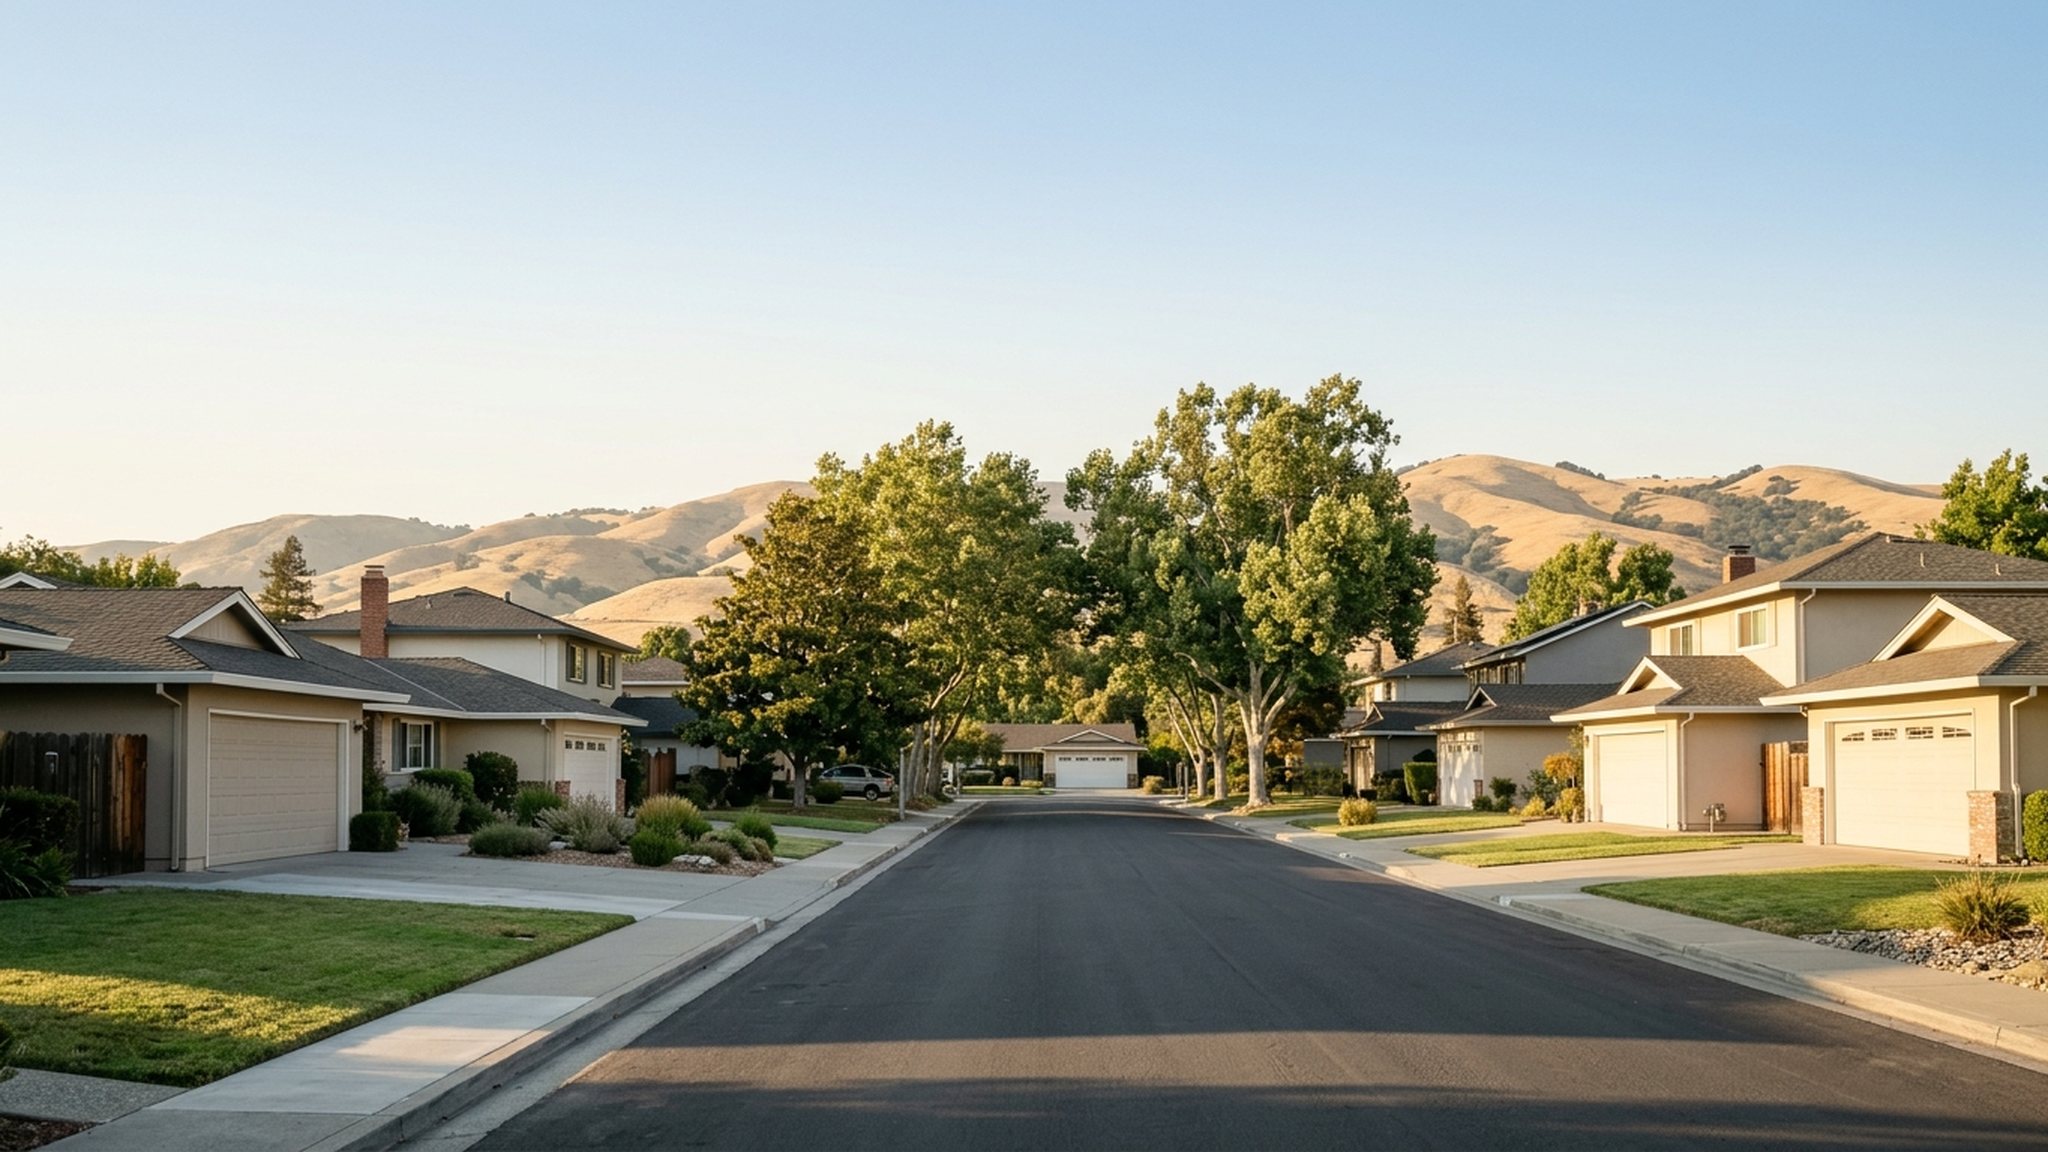
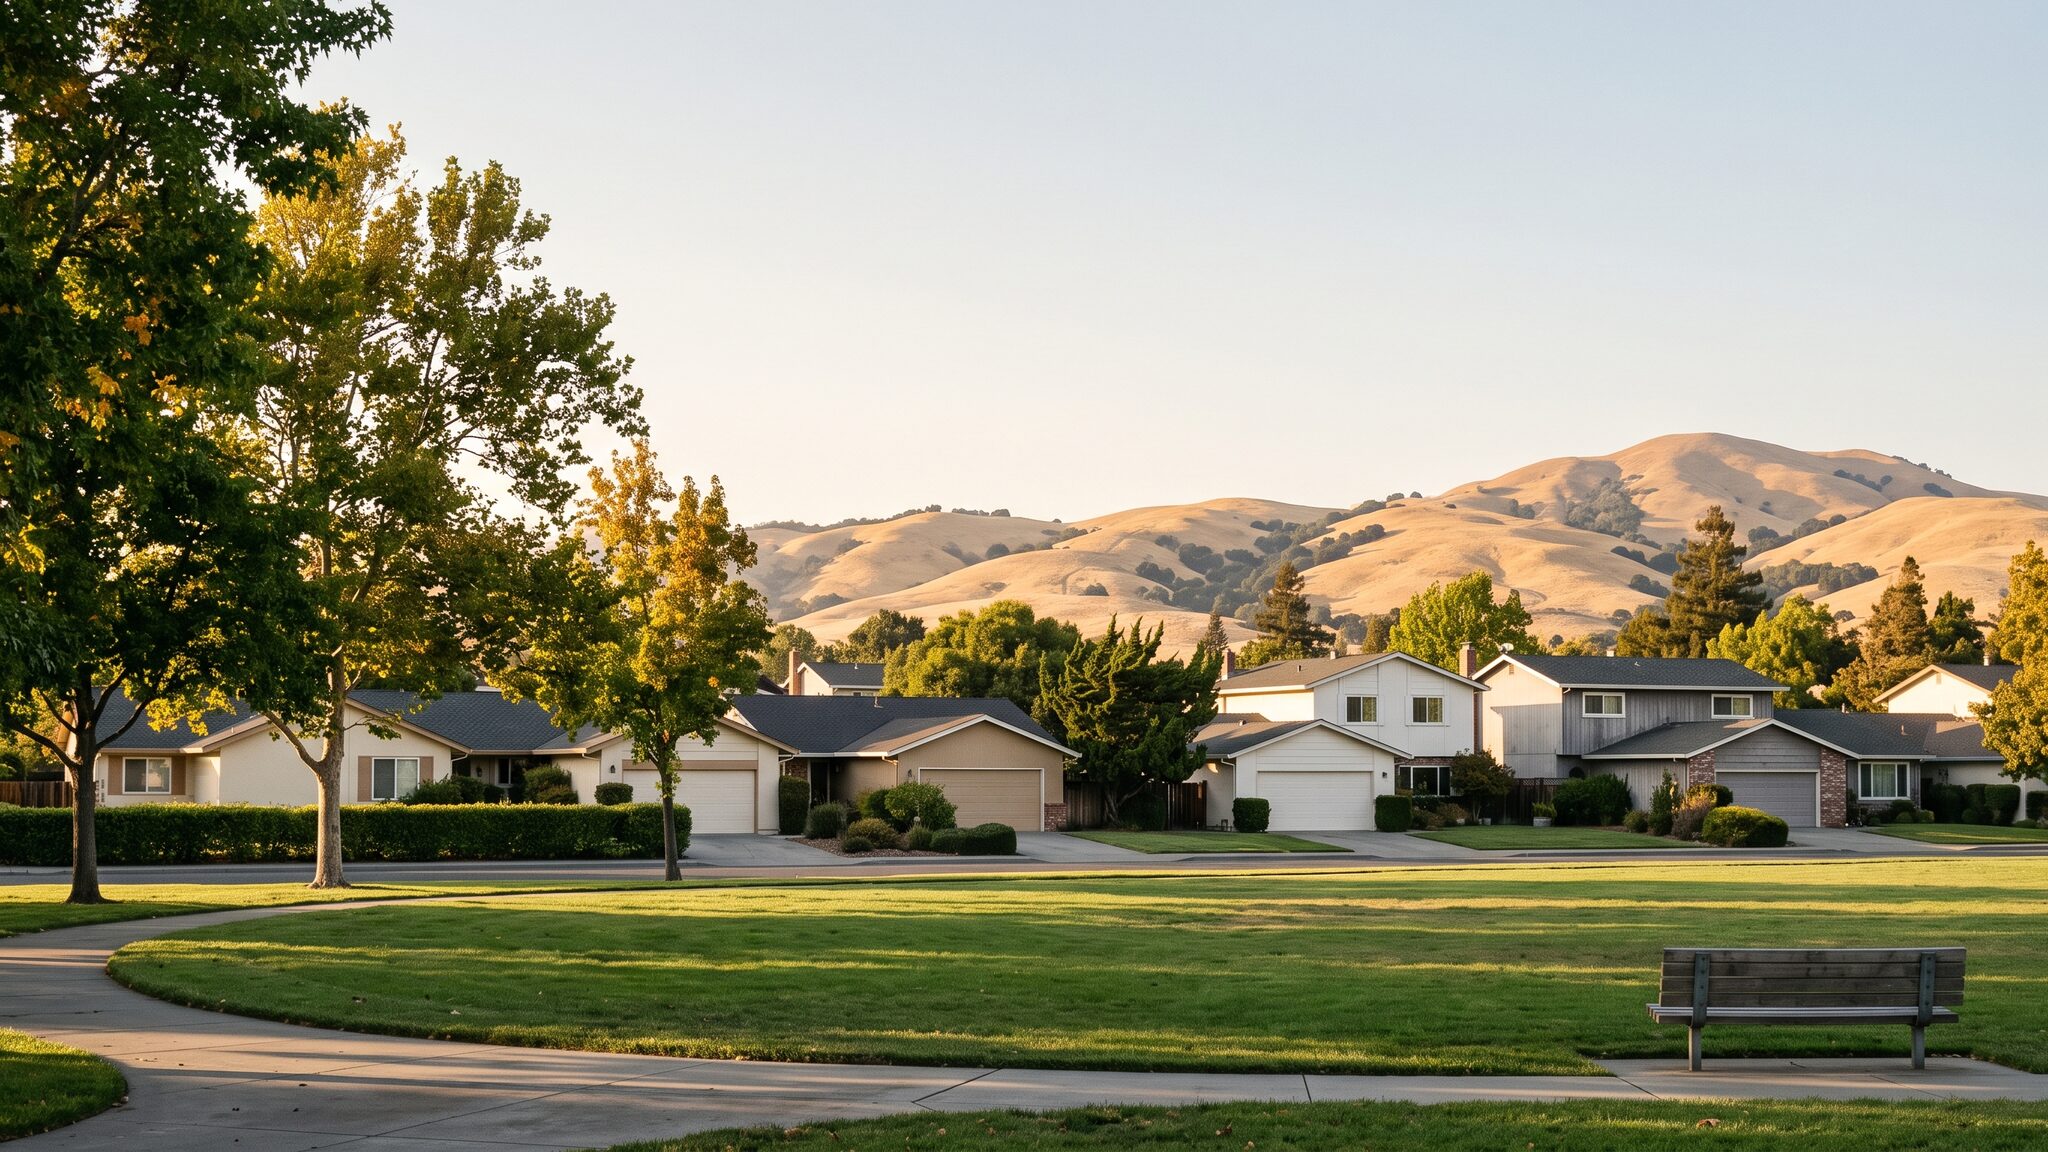
About the images: the header image is an AI illustration of a typical Newark neighborhood park, looking east across the lawn to a row of homes and the Mission Hills with Mission Peak. It is not a photograph of any specific home, and no property shown is a listing. Aerial photo: "Aerial view of Fremont, California and Newark, California in 2021" by Alfred Twu, CC0, via Wikimedia Commons, looking east over Newark and Fremont toward the Mission Hills, with the salt ponds at right. Cropped.
Equal Housing Opportunity. Harv Balu, CA DRE #02195792. REALTY EXPERTS® (CA DRE #00414413) is independently owned and operated. © 2026 Harv Balu, REALTY EXPERTS®.
Newark market questions, answered
What is the median home price in Newark right now?
The median sold price for a Newark single-family home was $1,298,000 in September 2026, according to the Bay East Association of REALTORS® and RPR market-trends report for the city as a whole. That is down 11.4% from August's $1,465,000. Read it alongside two other figures from the same report. The median price per square foot on closed sales rose 15.4% to $817, and RPR's median estimated value for Newark single-family homes was $1,348,730, down 0.8% from August and 2.4% from a year earlier. Taken together, my read is that September's lower median mostly reflects which homes sold, smaller ones, rather than an 11.4% drop in what a given Newark home is worth. The report does not break out home size, so that is an inference, not a measurement.
Is Newark a buyer's market or a seller's market in 2026?
By supply, it is still a seller's market, and RPR's own market-type gauge for September agrees. Newark finished September 2026 with 2.82 months of inventory, and the long-standing convention is that roughly six months of supply marks a balanced market, with anything meaningfully below that favoring sellers. The margin is shrinking, though. Months of supply rose 32.4% from August and 44.6% from a year earlier, to the highest point on the report's five-year chart. Active listings rose 26.5% to 62 while new contracts fell 24% to 19. The homes that did sell still went quickly and at about asking, averaging 100.97% of list after a median of 13 days on market. Sellers keep the structural edge, and buyers have more supply to choose from, measured against the pace of new contracts, than at any point in the last five years.
Why did Newark's median price fall while price per square foot rose?
Because the two numbers answer different questions. The median sold price reports the middle transaction of the month, so it moves whenever the kind of home selling changes. Price per square foot only partly adjusts for size, because smaller homes usually sell for less in total but more per foot. A month in which more smaller homes close tends to pull the median down and push the median price per foot up at the same time, which is September's pattern, and the mirror image of August's. So the most likely reading is that September's closings skewed toward smaller homes. The report does not break out home size, so that is an inference from the figures, not a measurement. The rise also ended a three-month slide in price per foot, from $874 in June to $793 in July and $708 in August, though one higher month on 25 sales does not make a trend.
How long does it take to sell a home in Newark?
It depends on which homes you measure. The homes that closed in September 2026 had spent a median of 13 days on market before going under contract, down 48% from August. The homes that went into contract during September got there in a median of 14 days, down 26.3%. The homes still active at month end had been listed a median of 27 days, up 17.4%. So the homes that found a buyer in September did it in about two weeks, while the homes still waiting had been on the market for nearly four weeks.
How many homes sold in Newark in September 2026?
Twenty-five single-family homes closed in Newark in September 2026, up 8.7% from August. Forty-one new listings came on the market, 62 were active at month end, 19 went into contract during the month, and 23 were pending when the month closed. Closings rose, but new contracts fell 24% and active listings rose 26.5%, so homes came on faster than buyers committed. Fewer new contracts usually means fewer closings in the month or two ahead. With only a couple dozen closings, one month's median can also swing on a handful of homes.
Where can I get the full Newark market report?
The complete report is available as a free printable PDF on this page. It includes every median price across the pipeline, the months-of-supply dial, the current-month supply and demand counts, and five-year context bands showing where September sits against the last five years. You can also reach me directly at (510) 600-3425 or homes@HarvRealtor.com for an address-specific opinion of value on your own home.
Your Local Real Estate Team

Harv Balu
REALTOR® | GRI, CIPS, PSA, FTBS · REALTY EXPERTS®
CA DRE# 02195792
REALTY EXPERTS® · 41051 Mission Blvd, Fremont, CA 94539
Read every post in HarvRealtor, my free app, and the words read offline. Download it free from the App Store® (opens in new tab).