Milpitas Real Estate Market Report, July 2026 | Median Prices, Inventory & Trends
Milpitas is still a seller's market in July 2026, but for the first time in a while the numbers give buyers a little room. The typical single-family home sold for $1,670,000, closed at 101.6% of its asking price, and went under contract in a median of 13 days, while inventory climbed to 1.86 months, up 56.3% from June and the most supply the city has carried since last summer. Here is the complete picture, recreated from the Bay East Association of REALTORS® and RPR market-trends data, with this week's live snapshot from Altos Research and a free branded PDF you can download and keep at the end.
July 2026 at a glance
Milpitas, CA, Single Family Residence, Median sold price $1,670,000, Sold-to-list 101.6%, Median 13 days on market, 1.86 months of inventory, 26 active listings, Median estimated value $1,649,570
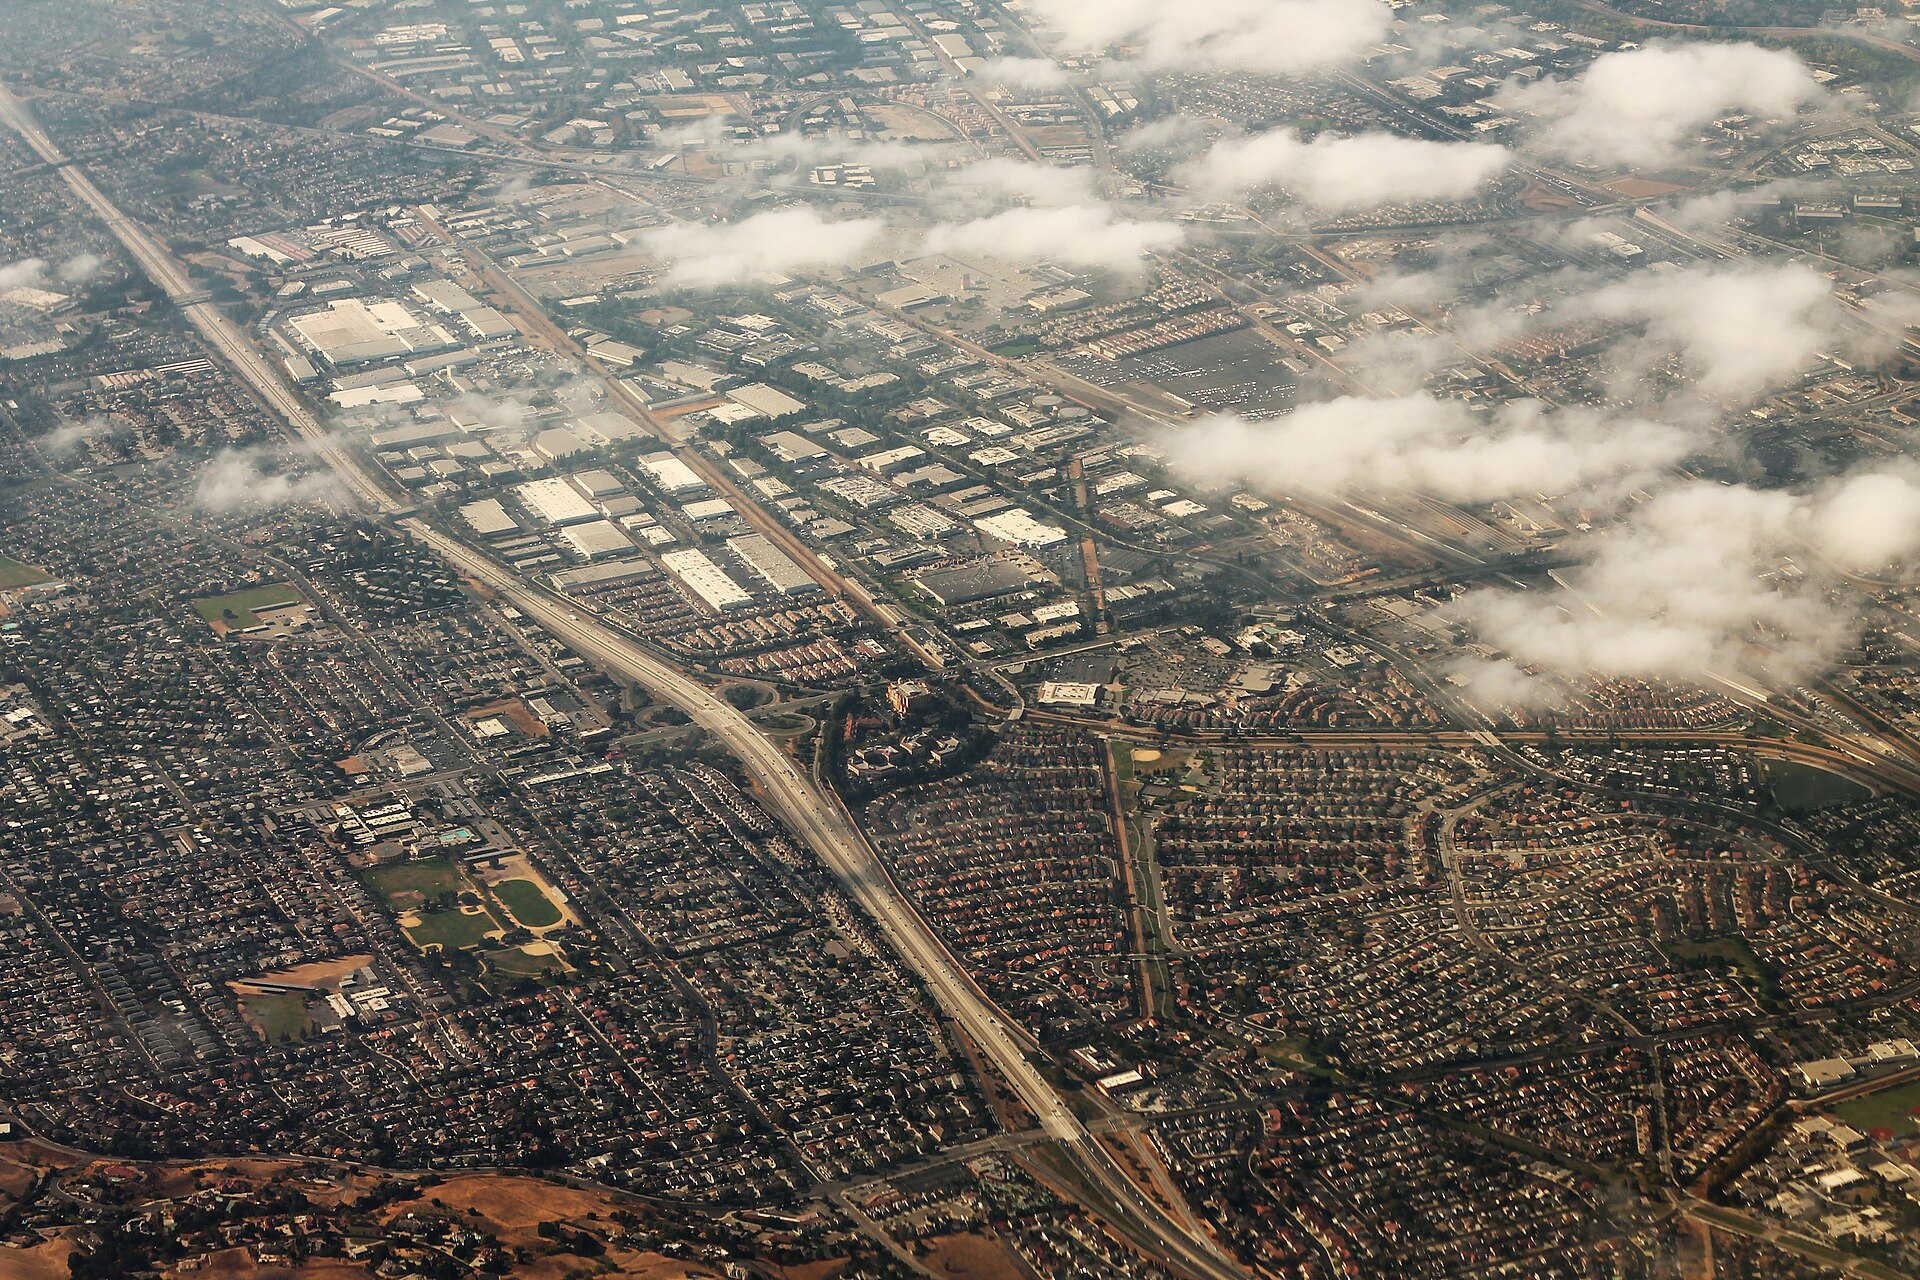
Photo: formulanone, Wikimedia Commons, CC BY-SA 2.0.
The interactive dashboard below walks through every number, the median sold price, the months-of-supply gauge, the full metric grid, and this month's supply and demand by stage.
The Milpitas market in July 2026
Single Family Residence citywide. All figures from the Bay East Association of REALTORS® / RPR market-trends report, data through July 2026.
Still seller's territory, but supply is loosening
Milpitas carried 1.86 months of supply in July, still well under the six-month mark that typically signals a balanced market, so this remains seller's territory. But the direction changed: supply rose (about 56%) from last month and is up 19.2% over the year, the most supply Milpitas has carried since last summer. With homes still closing at 101.6% of list in a median of 13 days, well-priced homes keep selling over asking, just with fewer bidders in the room than in June.
The full market profile
The six price tiles share one $0 to $1.9M scale, so the bars compare directly. The price per foot tile sits on its own scale.
How many homes, how many buyers
The month's pipeline by stage. Every count is exact from the report; the full five year trend context is in the free PDF.
Twenty-six homes came on and 26 sat active at month end, while 16 closed and 11 more went into contract. Months of inventory landed at 1.86, up about 56% from last month and 19.2% in a year, so buyers have more to choose from than they did in June, even though the balance still sits with sellers.
What the numbers are telling us
The median fell, but the price per foot rose. That is a mix story, not a value story. The median sold price of $1,670,000 is down 7.2% from June, and on its own that reads like a soft month. Look one line further: the median price per square foot on closed sales rose 4.1% to $1,017. A median is sensitive to which homes happen to close in a given month; price per square foot is far less so. When the two move in opposite directions, the mix of what sold changed, in July toward smaller homes, and the value of a Milpitas square foot did not fall. It is the same signature I found in Fremont's July numbers, and the opposite of what happened in Newark, where both measures fell together.
Supply is loosening, and that is the real change this month. Months of inventory finished July at 1.86, up 56.3% from June and up 19.2% over the year. Twenty-six new listings came on, 62.5% more than the month before, and 26 homes sat active at month end. Anything under three months still counts as a seller's market, and Milpitas sits well under that line, but buyers have not had this much to choose from since last summer.
Buyers are paying over asking, just a little less over. A sold-to-list ratio of 101.6% means the typical Milpitas home closed about 1.6% above its list price, down from the 104.1% pace this report implies for June. Combine that with a median of 13 days to pending and the message is: well-priced homes still sell fast and over asking, with fewer competing bidders than in early summer. If you are selling into this market, the overpricing trap matters more now than it did a month ago.
Demand cooled at the contract stage. Only 11 homes went into contract in July, down 35.3% from June, and 8 were pending at month end, down 38.5%. Closed sales held at 16. More homes coming on while fewer go pending is exactly how months of inventory rises, and it is the number to watch in August.
Estimated values have softened over the year. RPR's median estimated home value sits at $1,649,570, up 0.2% for the month but down 9.6% over the past year. Closings stayed strong even as the broader valuation eased, which is why pricing to the live market matters more than any headline number.
Prices across the pipeline
Here is where prices sat at each stage of the Milpitas market in July 2026:
- New listings, median list price $1,591,500 across 26 new homes
- Active, median list price $1,593,000 across 26 homes on the market
- New pending, median list price $1,680,000 across 11 fresh contracts
- Pending, median list price $1,790,000 across 8 homes awaiting close
- Sold, median sold price $1,670,000 across 16 closed homes
- Median price per square foot, $1,017 on closed single-family sales, versus $994 on today's active listings
The homes that went under contract in July were priced above the ones that closed, with the pending median at $1,790,000 against a $1,670,000 closed median. That is the pipeline's way of saying August's closings may land higher than July's did.
Supply and demand this month
July brought 26 new listings, and 26 homes sat active at the end of the month. Meanwhile 11 homes went into contract, 8 were pending at month end, and 16 closed. With months of inventory at 1.86, up 19.2% from a year ago, Milpitas still carries less supply than most Bay Area markets, but the gap is narrower than it was in June.
Where the market stands this week
The RPR figures above describe July's closings. For a read on right now, Altos Research's weekly snapshot of Milpitas single-family homes for sale, dated September 1, 2026, shows a median list price of $1,650,000, 21 homes on the market, a median of 28 days on market across the active inventory, and a Market Action Index of 52, up from 49 a month earlier and inside what Altos labels a strong seller's market. About 24% of the active listings have taken a price cut, and none have raised their price. In plain terms: the supply that built up in July is already being absorbed, and this week's numbers lean a little more toward sellers than July's did.
A note for condo and townhome buyers
Everything above is the single-family market. Milpitas condos and townhomes trade in their own lane, with their own prices and pace, and that is the lane where I am hosting an open house this weekend: 341 Imagination Pl in Parc Metro, a 3-bed, 3-bath townhome-style condo at $968,000, open Saturday, October 3 from 2 to 5 PM and Sunday, October 4 from 1 to 4 PM. If a condo is what you are shopping for, that post has the block-by-block comparison, and I will have printed copies of this report at the door.
Come See a Milpitas Condo in Person
The report above is the single-family market. If a condo or townhome is what you are shopping for, I am hosting an open house in Parc Metro this weekend, Saturday, October 3, 2 to 5 PM and Sunday, October 4, 1 to 4 PM. Tap the card for the full write-up, the video walkthrough, and the flyer.
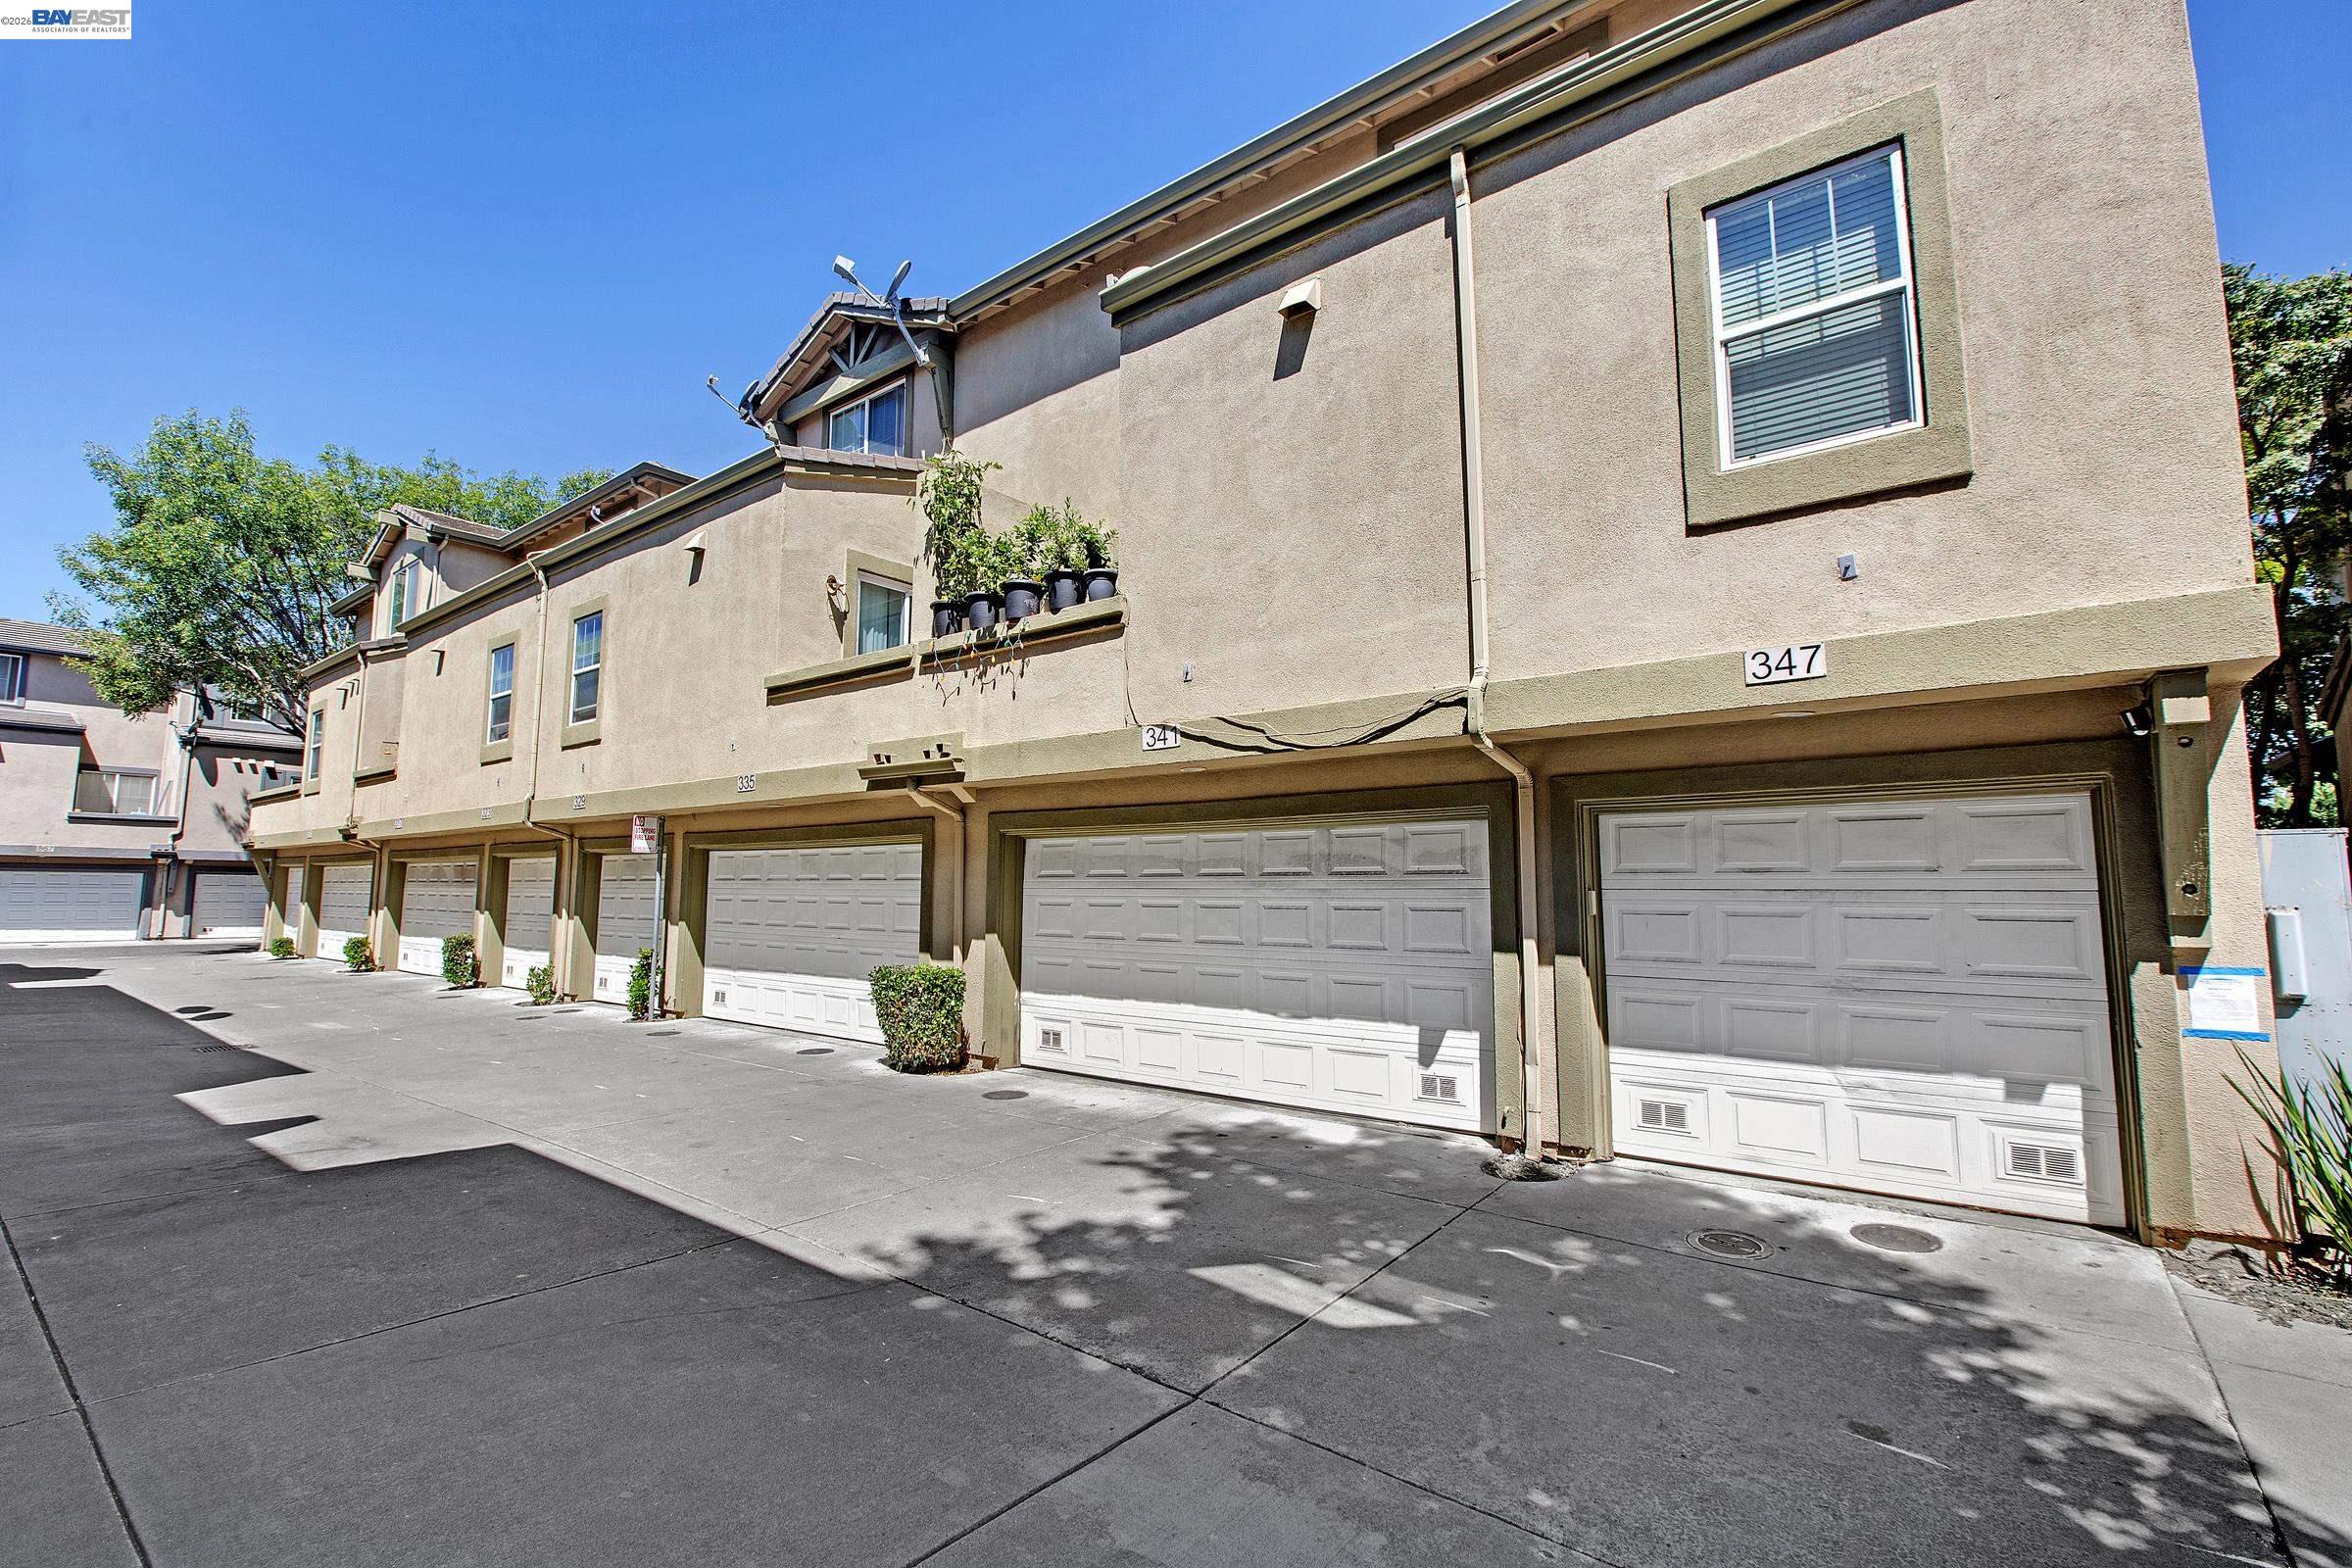
341 Imagination Pl
Milpitas, CA 95035
$968,000
MLS# 41141835
3
Bed
3
Bath
1,243 sq ft
Sq Ft
Townhome-style condo, price improved $100,000, open Sat and Sun 2 to 5 PM.
A first-floor bedroom and full bath plus two upstairs primary suites, in a community with a pool, spa, and clubhouse. Listed by Shelly Arora, REALTY EXPERTS®; Harv Balu is hosting the open house and available to represent buyers.
See one you'd like to tour? I'd love to walk you through any of these, or anything else in the area.
Get the full report, free
I put the entire month into a clean, printable PDF: every median price across the pipeline, the months-of-supply gauge, this month's supply and demand counts, and the five year trend bands, all in my own branding rather than a generic template.
Thinking about a move in Milpitas?
A market report tells the story of the whole city. To know what it means for your specific home or your next purchase, let's talk. I will put together a true, address-specific opinion of value based on the homes actually selling on your street, no pressure, no obligation. Call or text me at (510) 600-3425, or email homes@HarvRealtor.com. If you are weighing a sale, my seller's guide is the right place to start, the Milpitas city guide is a good neighborhood-by-neighborhood overview, and June's report shows how quickly the picture moved in one month.
Not a guarantee. Market figures are from the Bay East Association of REALTORS® and Realtors Property Resource® (RPR®), deemed reliable but not guaranteed, and are not a prediction of future value. Month-over-month percentages are as printed in the July report; RPR revises prior months, so June's figures implied here can differ slightly from those in my June report. The weekly snapshot is from Altos Research as of September 1, 2026. All figures describe the broader Milpitas single-family market and may not reflect any individual home. Harv Balu, REALTOR® (CA DRE #02195792) · REALTY EXPERTS® (CA DRE #00414413). Equal Housing Opportunity.
Your Local Real Estate Team

Harv Balu
REALTOR® | GRI, CIPS, PSA, FTBS · REALTY EXPERTS®
CA DRE# 02195792
REALTY EXPERTS® · 41051 Mission Blvd, Fremont, CA 94539
Read every post in HarvRealtor, my free app, and the words read offline. Download it free from the App Store® (opens in new tab).