Newark Real Estate Market Report, July 2026 | Median Prices, Inventory & Trends
Newark stayed on the seller's side of the table in July 2026, and the headline this month is a genuine split: supply got tighter while prices got softer. The typical single-family home sold for $1,325,000, closed at 101.6% of its asking price, and went under contract in a median of 18 days, while months of inventory fell to 2.17, down about 18% from June. Here is the complete picture, recreated from the Bay East Association of REALTORS® and RPR market-trends data, with a free branded PDF you can download and keep at the end.
July 2026 at a glance
Newark, CA, Single Family Residence, Median sold price $1,325,000, Sold-to-list 101.6%, Median 18 days on market, 2.17 months of inventory, 50 active listings, Median estimated value $1,373,100

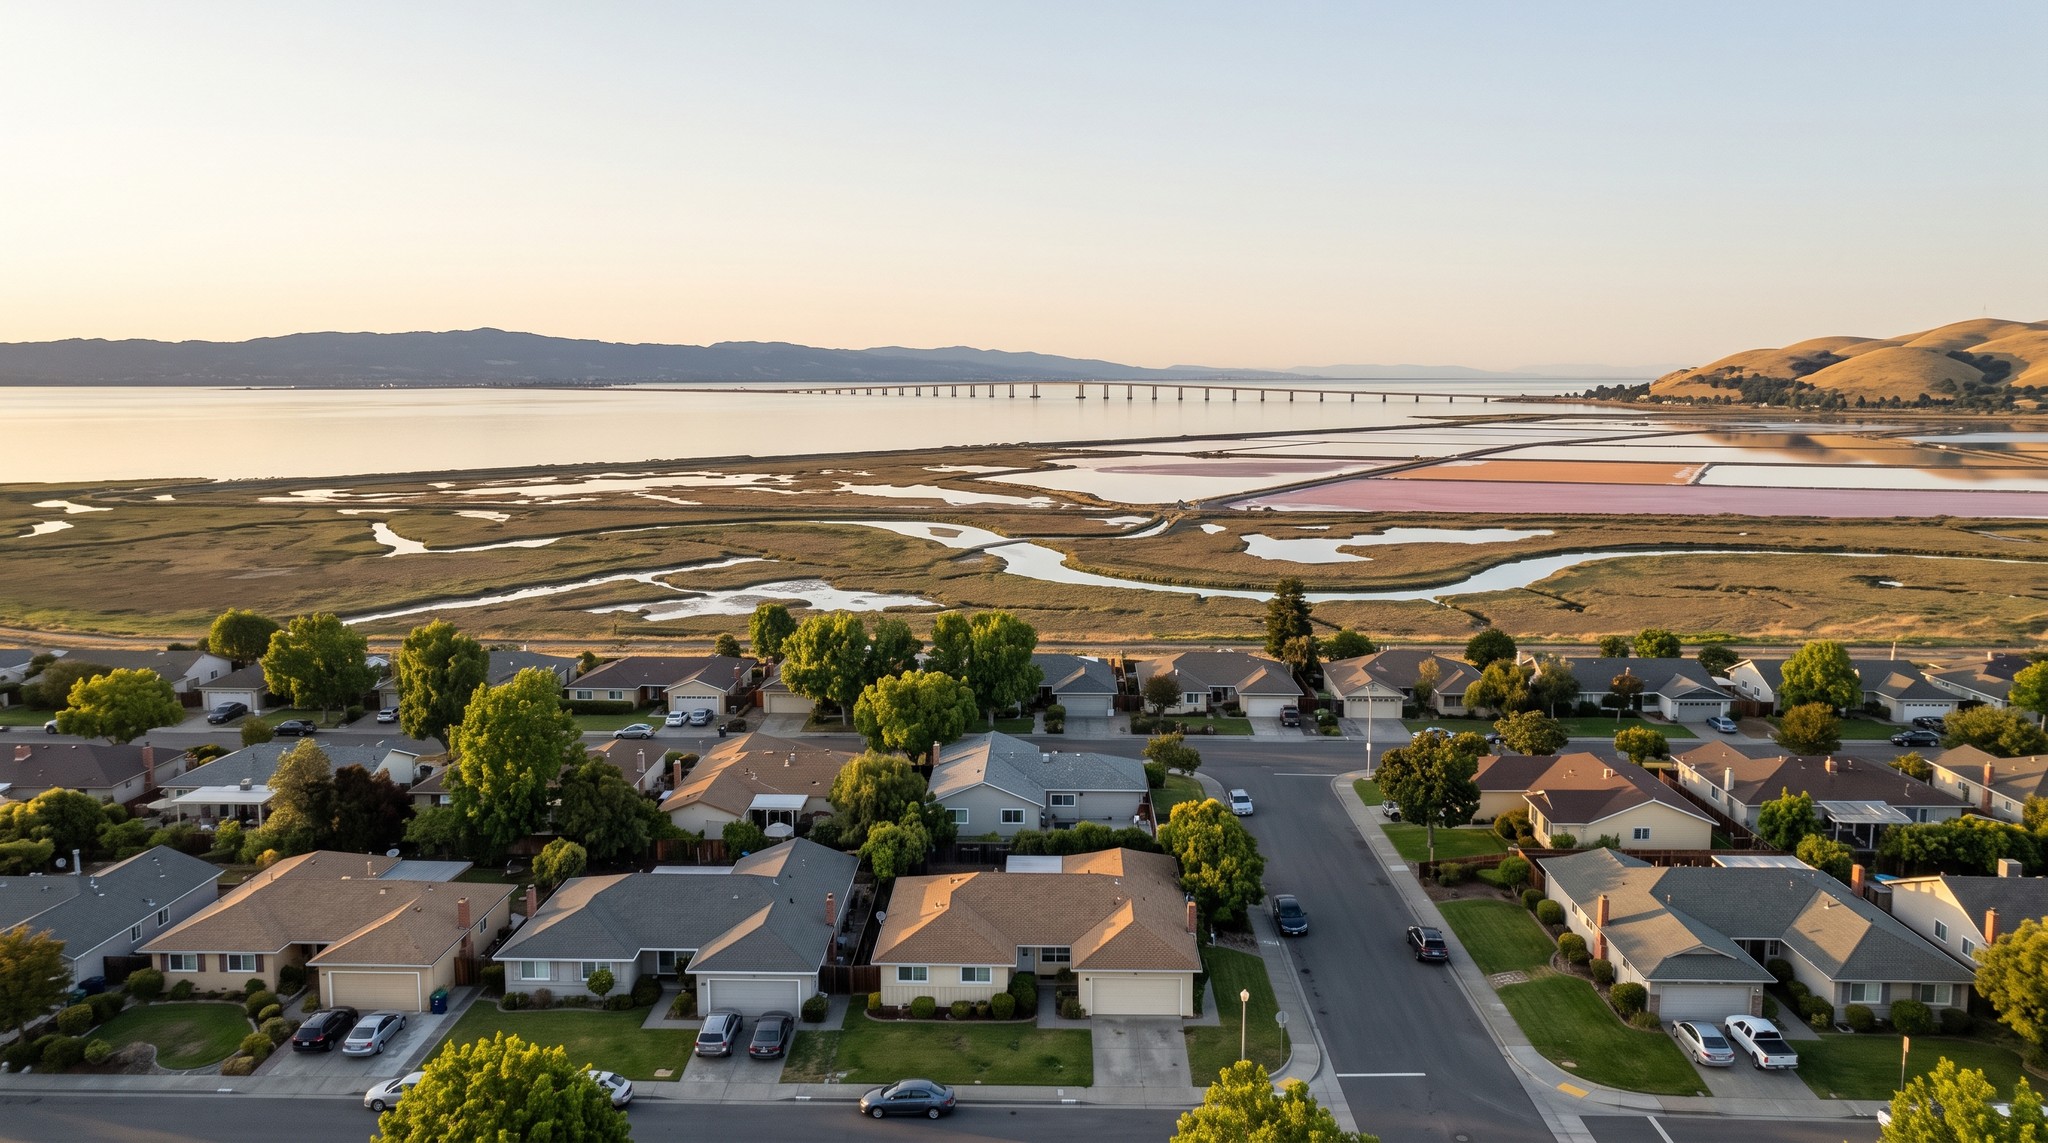
Photo: Alfred Twu, Wikimedia Commons, CC0.
The interactive dashboard below walks through every number, the median sold price, the months-of-supply gauge, the full metric grid, and this month's supply and demand by stage.
The Newark market in July 2026
Single Family Residence citywide. All figures from the Bay East Association of REALTORS® / RPR market-trends report, data through July 2026.
Deep in seller's territory, and tightening
Newark carried 2.17 months of supply in July, far under the six-month mark that typically signals a balanced market, and firmly in seller's territory. Supply actually tightened this month: inventory fell (about 18%) from last month and is down 0.5% over the year. With homes still closing at 101.6% of list in a median of 18 days, well-priced, move-in-ready homes continue to draw quick, competitive offers.
The full market profile
The six price tiles share one $0 to $1.5M scale, so the bars compare directly. The price per foot tile sits on its own scale.
How many homes, how many buyers
The month's pipeline by stage. Every count is exact from the report; the full five year trend context is in the free PDF.
Thirty-two homes came on and 50 sat active at month end, while 31 closed and 17 more went into contract. Months of inventory landed at 2.17, down about 18% from last month and 0.5% over the year, so supply tightened even as prices eased.
What the numbers are telling us
Supply tightened, and this is still clearly a seller's market. Months of inventory finished July at 2.17, down 18.1% from last month and down 0.5% over the past year. Anything under three months counts as a seller's market, and six months is the conventional balanced line, so Newark is not close to the tipping point. This is a reversal in direction from last month's Newark report, where supply was building toward the top of its five year range. One note on comparisons: RPR revises prior months as late data lands, so the June baseline inside this report is not identical to the figure June's own report published. All month-over-month percentages here are the ones this report calculated.
Buyers are still paying over asking, with a slightly thinner premium. A sold-to-list ratio of 101.6% means the typical Newark home closed about 1.6% above its list price, down from the prior month. Pair that with a median of 18 days to pending and the picture is a market that is still competitive, just not frantic.
Prices eased, and this one is harder to write off as a mix shift. The median sold price of $1,325,000 is down 4.57% from last month. Normally a single month's median tells you as much about which homes happened to close as it does about value, and the honest check is price per square foot, which is far less sensitive to the mix. Here it moved the same way and further: $793 per square foot on closed sales, down 9.3%. That combination points to softer pricing on comparable space rather than simply a different set of houses. It is the opposite pattern from Fremont in the same month, where the median fell while price per foot rose.
Estimated values softened too. RPR's median estimated home value sits at $1,373,100, down 2.9% for the month and down 3% over the past year. That is a citywide model estimate rather than an appraisal, but it is moving in the same direction as the closings, which makes the month more coherent than most.
The contract pipeline is carrying pricier homes than the closings did. New pendings signed in July had a median list price of $1,399,999 and homes already pending sat at $1,490,000, both above July's $1,325,000 median close. Meanwhile what is actually on the market is cheaper, with active listings asking a median of $1,309,000. If those higher-priced contracts close, they would pull the next month or two of medians back up, which is a good reason not to read one soft month as a trend.
Prices across the pipeline
Here is where prices sat at each stage of the Newark market in July 2026:
- New listings, median list price $1,299,999 across 32 new homes
- Active, median list price $1,309,000 across 50 homes on the market
- New pending, median list price $1,399,999 across 17 fresh contracts
- Pending, median list price $1,490,000 across 26 homes awaiting close
- Sold, median sold price $1,325,000 across 31 closed homes
- Median price per square foot, $793 on closed single-family sales, versus $804 on today's active listings
Closed sales clearing above where sellers set fresh July asking prices, while the homes under contract sit higher still, is the sort of spread you see when the market is sorting itself by price band rather than moving as one block.
Supply and demand this month
July brought 32 new listings, and 50 homes sat active at the end of the month. Meanwhile 17 homes went into contract, 26 were pending at month end, and 31 closed. Closings outran new contracts, and both new listings and active inventory fell, which is exactly the arithmetic that drives months of inventory down to 2.17 even in a month when prices eased.
Get the full report, free
I put the entire month into a clean, printable PDF: every median price across the pipeline, the months-of-supply gauge, this month's supply and demand counts, and the five year trend bands, all in my own branding rather than a generic template.
Thinking about a move in Newark?
A market report tells the story of the whole city. To know what it means for your specific home or your next purchase, let's talk. I will put together a true, address-specific opinion of value based on the homes actually selling on your street, no pressure, no obligation. Call or text me at (510) 600-3425, or email homes@HarvRealtor.com. If you are weighing a sale, my seller's guide and my post on the overpricing trap are the right place to start, and the Newark city guide is a good neighborhood-by-neighborhood overview.
Not a guarantee. Market figures are from the Bay East Association of REALTORS® and Realtors Property Resource® (RPR®), deemed reliable but not guaranteed, and are not a prediction of future value. They describe the broader Newark single-family market and may not reflect any individual home. RPR revises prior months as late data arrives, so month-over-month figures are as calculated in this report. Harv Balu, REALTOR® (CA DRE #02195792) · REALTY EXPERTS® (CA DRE #00414413). Equal Housing Opportunity.
Newark July 2026 Market Questions
Did Newark home prices drop in July 2026?
The median sold price fell 4.6% month over month, to $1,325,000. Unlike some months, this one is not easily explained away as a change in the mix of homes that happened to close. The median price per square foot on closed sales fell too, and fell harder, down 9.3% to $793. When only the median moves, a different mix of homes selling is usually the reason. When price per square foot moves in the same direction, and by more, it points to softer pricing on comparable space rather than simply a different set of houses. That said, one month is one month, and a city the size of Newark closes about thirty single-family homes in a typical month, so any single reading carries real noise.
Is Newark still a seller's market in July 2026?
Yes, and by this data it got tighter rather than looser. Months of inventory finished July at 2.17, down 18.1% from the prior month and down 0.5% over the year. Anything under roughly three months is the classic marker of a seller's market, and six months is the conventional balanced line, so Newark sits well inside seller's territory. Homes also continued to close above asking, at 101.6% of list, and the typical sale went under contract in a median of 18 days.
How many homes sold in Newark in July 2026?
Thirty one single-family homes closed in July, up 10.7% from the prior month. Alongside that, 32 homes were newly listed, 50 were active at month end, 17 went into contract during the month, and 26 were pending at month end. Closings rose while new listings, new contracts and active inventory all fell, which is what pushed months of inventory down even though the market did not get visibly busier.
How long does it take to sell a home in Newark right now?
The median closed sale in July took 18 days to go pending, up from 14 the prior month. Homes sitting in active status showed a median of 35 days on market. Both figures are still quick by any historical standard, and they describe the citywide single-family median rather than any particular home or neighborhood. A well-prepared, correctly priced home can still go under contract in a week, while an overpriced one can sit for months without a single offer.
What is the typical Newark home worth in July 2026?
RPR's automated median estimated value for Newark was $1,373,100, down 2.9% for the month and down 3% over the past year. That is a model estimate across the whole city, not a formal appraisal, and it will not reflect the condition, location or upgrades of any individual property. For an address-specific opinion of value, the right tool is a comparative market analysis on the homes actually selling on your street.
Your Local Real Estate Team

Harv Balu
REALTOR® | GRI, CIPS, PSA, FTBS · REALTY EXPERTS®
CA DRE# 02195792
REALTY EXPERTS® · 41051 Mission Blvd, Fremont, CA 94539
Read every post in HarvRealtor, my free app, and the words read offline. Download it free from the App Store® (opens in new tab).