Union City Real Estate Market Report: Still Over Asking, but Only Just
Union City is still a seller's market, but October 2026 showed how far the spring rush has faded. The typical single-family home sold for $1,363,000, down 2.3% from September and about level with a year ago. The average sale closed at 100.22% of list price, still over asking, and the lowest reading since January 2024, when homes sold below asking. And the homes that sold had spent a median of 23 days on market, the longest since August 2025.
None of that makes Union City a buyer's market. Supply sits at 2.25 months, far under the six months that marks a balanced one. What it does mean is that the habits of the spring, list a little low and let the offers pile up, are not the habits of this fall.
Here is the complete picture, recreated from the Bay East Association of REALTORS® and RPR market-trends data, with a free branded PDF you can download and keep at the end.
October 2026 at a glance
Union City, CA, Single Family Residence, Median sold price $1,363,000, Sold-to-list 100.22%, Median 23 days on market, 2.25 months of inventory, 22 closed sales, Median estimated value $1,421,950
The interactive dashboard below walks through every number: the median sold price, the months-of-supply dial, the shrinking premium over asking, the full metric grid, and this month's supply and demand by stage.
The Union City market in October 2026
Single Family Residence, citywide Union City. Not condos or townhomes.
All figures from the Bay East Association of REALTORS® / RPR market-trends report, data through October 2026.
Still a seller's market, with nearly a third more supply than a year ago
Union City carried 2.25 months of supply in October, well under the six-month mark that typically signals a balanced market. That is up 2.3% from about 2.20 in September, the highest since May, and up 31.6% from 1.71 a year ago. Active listings edged up to 45 while 21 homes went into contract. The homes that closed averaged 100.22% of list after a median of 23 days on market, the longest since August 2025. Sellers keep the edge, and buyers have more room than they did in the spring.
The premium over asking has shrunk since February
How far the average sale closed above list price, each month since February.
- Febabout 109.1%
- Marabout 105.6%
- Aprabout 104.3%
- Mayabout 103.1%
- Junabout 102.1%
- Julabout 100.8%
- Augabout 100.7%
- Sepabout 100.4%
- Oct100.22%
From about 109% in February to 100.22% in October, the lowest since January 2024.
Homes still closed above asking on average, so this is not a buyer's market. It is a market where bidding far over list has largely stopped. A year ago the same figure was about 102.6%. These monthly readings include RPR's later revisions.
Why the median dipped while price per foot rose
Three figures from the same report, each shown as its change from September.
The median and price per foot moved apart, which points to which homes sold. The model value fell too.
Price per foot bounced 8% from about $702 in September, its lowest reading since January 2023. Smaller homes closing would explain a lower median alongside a higher price per foot. RPR's estimate of the typical home also fell 3%, and that part is not about the mix. The report has no home-size data, so this is a reading of the figures, not a measurement.
Where buyers went into contract, and what is still waiting
Two groups of homes from the same report: the ones that went into contract in October, and the ones still active at month end.
Higher median list price on the homes still waiting, and nine more days on market so far. A gap between two groups of homes, not a verdict on any one of them.
The full market profile
The six price tiles share one $0 to $2M scale, so the bars compare directly. The two price per foot tiles carry a decorative rule, not a scaled bar.
How many homes, how many buyers
The month's pipeline by stage. Every count is exact from the report; the free PDF adds five-year context bands for price, price per foot, sold to list and months of supply.
Thirty-two homes came on and 45 sat active at month end, while 22 closed and 21 more went into contract. Closings rose 57.1% from September and new contracts rose 16.7%, while new listings fell 11.1%. Months of inventory landed at 2.25, up 2.3% from September and up 31.6% from a year ago.
The premium over asking has shrunk since February
This is the number I would watch most closely right now. In February the average Union City sale closed at about 109% of list. On RPR's current chart it has come down every month since: about 105.6% in March, about 103.1% in May, about 100.8% in July, about 100.4% in September, and 100.22% in October. The February to September figures are read from the five-year chart in the report, so they are approximate, and they include RPR's later revisions; August's report as first published showed a small rise from July. October's figure is exact.
A year ago the same figure was about 102.6%. In plain terms, the typical buyer today is paying about the list price, not tens of thousands over it. That changes how negotiations go, even though homes are still, on average, closing a hair above asking.
Homes are taking longer to sell
The homes that closed in October had spent a median of 23 days on market, up 64% from about 14 in September, and the longest since August 2025. That number runs from listing to contract, not to closing.
The rest of the market slowed too. Listings still active at month end had been on the market a median of 31 days, up 63%. The homes that went into contract during October took a median of 22 days to get there, up 22%.
Three weeks is still a reasonable pace. It is just not the pace of the spring, and a home that misses on price now has time to sit.
More closings, and a little more supply
October was busier at the closing table. 22 homes closed, up 57.1% from September, and 21 new contracts were signed, up 16.7%. Fewer sellers listed: 32 new listings, down 11.1%.
Even so, supply edged up. Months of inventory reached 2.25, up 2.3% from September and the highest since May. Against a year ago it is up 31.6%, from 1.71. Active listings ended the month at 45, up from about 44 in September and about 36 a year ago.
The longer view explains it. Over the past twelve months, sellers listed about 373 homes, against about 336 in the twelve months before, while new contracts were about flat, roughly 245 against 252. Those totals are summed from the report's monthly charts, so treat them as approximate. Sellers have come back faster than buyers, and that is likely the slow build behind the higher supply number.
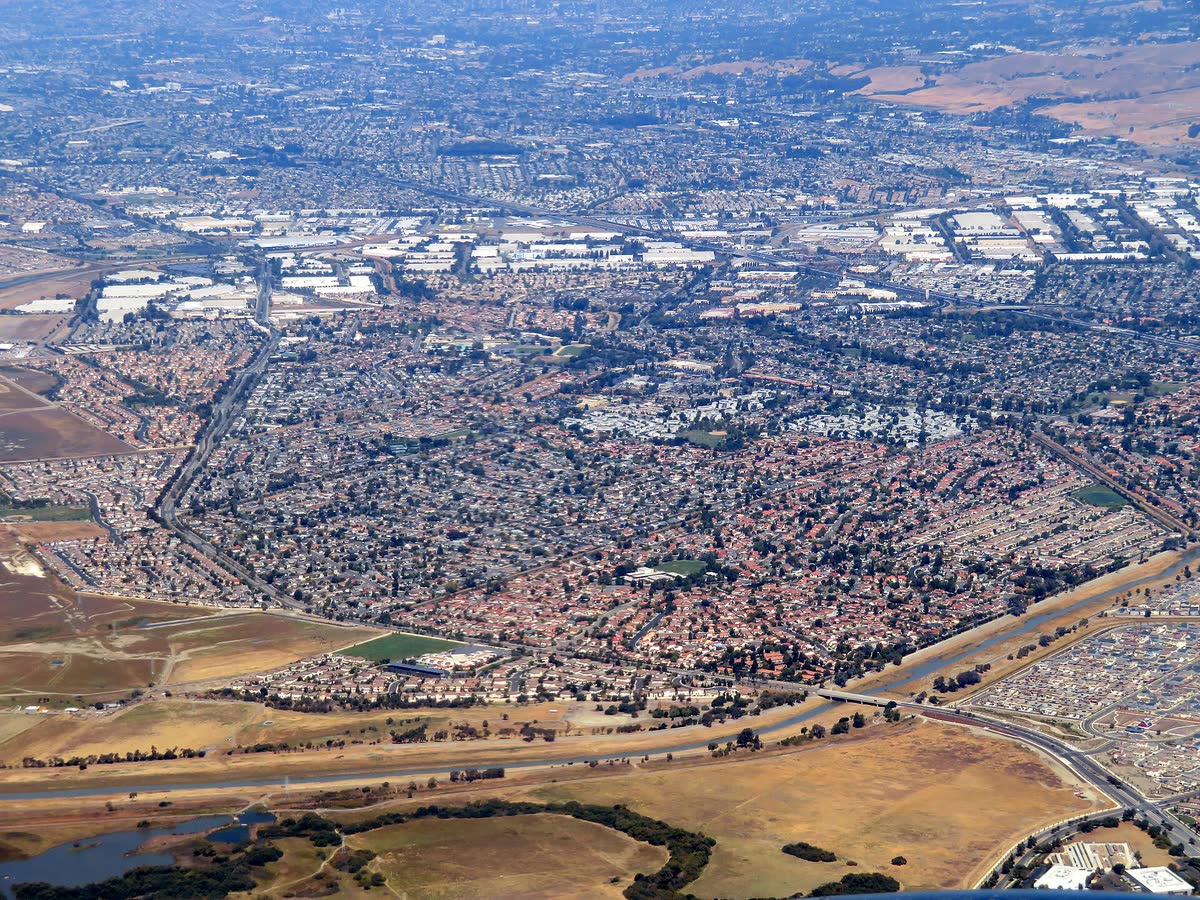
Union City from the air: the flat bayside grid, the Alameda Creek channel, and the East Bay hills that close the valley. Photo by Pi.1415926535, CC BY-SA 3.0, via Wikimedia Commons.
The median dipped while price per foot jumped
The median sold price fell 2.3% to $1,363,000. The median price per square foot rose 8% to $758. When those two move apart, the mix of homes usually changed. A lower median alongside a higher price per foot fits a month in which smaller homes made up more of the sales. The report has no home-size data, so that is my reading of the figures, not a measurement.
Two cautions keep the 8% in proportion. September's price per foot, about $702, was the lowest reading on the report's five-year chart since January 2023, so part of October's jump is a rebound from a weak month. And at $758, price per foot is still about 7% below October 2025's roughly $819.
A third number does not depend on the mix at all. RPR's model estimate of the typical Union City home, the median estimated value, fell 3% in October to $1,421,950, and is down 2.8% from a year ago. It is a model, not an appraisal, but it points the same way as the shrinking premium: values have softened a little over the past month and year.
Homes going into contract were listed below October's median
The homes that went into contract in October were listed at a median of $1,298,000, down 7.1%, and about $90,000 below the median active listing at $1,388,000. The homes pending at month end were listed at a median of $1,250,000, down 10.6%.
Those are list prices, not sale prices, and contracts can fall through or close above or below asking. Homes going into contract listed below both the active inventory and October's median sale is worth watching, not a forecast. A similar pipeline in July was followed by a higher median in August. November's report will tell.
Where October sits in a five-year view
Measured against the plotted five-year trend in the source report, October 2021 through October 2026:
- Median sold price has ranged from about $1,142,000 (December 2023) to about $1,645,000 (February 2022). October's $1,363,000 sits a little below the middle of that range.
- Sold price per square foot has ranged from about $659 (January 2023) to about $936 (April 2024). October's $758 sits in the lower half.
- Sold to list price has ranged from about 95.3% (August 2022) to about 118.1% (February 2022). October's 100.22% is the lowest since January 2024.
- Months of supply has ranged from about 0.28 (December 2021) to about 2.67 (July 2022). October's 2.25 sits near the top, which shows how tight Union City has been for five years: even its loosest month was nowhere near balanced.
Those band edges are approximate, read from the plotted five-year series in the source report. Each current value is exact.
What this means if you are selling
Price for this fall, not last spring. From February through April, buyers paid about 104% to 109% of list. In October they paid about 100%. A price that counts on a bidding war to carry it higher is less likely to get one now.
Plan for a few weeks. A median 23 days to contract is still a reasonable pace, so build it into your timeline. The first two weeks still bring the most attention from buyers with alerts set, and in my experience that is when a pricing mistake costs the most.
Supply is still on your side. At 2.25 months, you are not competing against a flood of listings. You are competing for buyers who now have time to compare.
What this means if you are buying
You have more room than you did in the spring. With homes closing at about list price and staying on the market longer, offers at or near asking, with inspection and appraisal contingencies in place, are more realistic than they were six months ago. That is the direction of the whole market, not a promise about any one home; a well-priced home in good condition can still draw more than one offer.
Look at what has been sitting. Listings still active at the end of October had a median of 31 days on market. A seller a month into a listing is often more open to a conversation.
Waiting for a buyer's market could be a long wait. At 2.25 months of supply, Union City is not close to one. More room to negotiate is not the same thing as falling prices.
For a look at the cities next door, see my Newark September report and my Hayward September report. For neighborhoods, schools and getting around, see my Union City city guide.
Past months
This page is rewritten each month with the newest report. Earlier months stay here, with each figure exactly as it was published.
No September 2026 report was published.
August 2026, single-family homes: median sold price $1,450,000, up 10.5% from July; a median $729 per square foot sold, down 5.8% from July; 1.71 months of supply; a median 12 days on market; and 100.7% of list price. Read the August report (PDF).
No July 2026 report was published.
June 2026, single-family homes: median sold price $1,327,500, a median $785 per square foot sold, 1.76 months of supply, a median 15 days on market, and 102.1% of list price. Read the June report (PDF), or watch the June market video.
May 2026, single-family homes, condos and townhouses together: median sold price $1,340,000, 2.67 months of supply, a median 13 days on market, and 103.5% of list price. The May report's headline price per square foot was for new listings, so it is left out here. Read the May report (PDF), or watch the May market video.
Thinking about a move in Union City?
A market report tells the story of the whole city. To know what it means for your specific home or your next purchase, let's talk. I will put together a true, address-specific opinion of value based on the homes actually selling on your street, no pressure, no obligation. Call or text me at (510) 600-3425, or email homes@HarvRealtor.com. A couple of recent Union City homes I have written up: 4339 Queensboro Way and 221 Dutra Vernaci Dr.
About the data. Based on information from the Bay East Association of REALTORS® as of November 9, 2026. All October figures describe the Union City single-family residential market citywide. Monthly sold-to-list readings before October, September's price per square foot, the year-ago comparisons and the twelve-month totals are read from the report's own five-year charts and are approximate. Properties may or may not be listed by the office or agent presenting this information. The Past months section repeats each earlier report's figures as published; the May 2026 report also counted condos and townhouses.
Not a guarantee. Market figures are from the Bay East Association of REALTORS® and Realtors Property Resource® (RPR®), deemed reliable but not guaranteed, and are not a prediction of future value. They describe the broader Union City single-family market and may not reflect any individual home. Harv Balu, REALTOR® (CA DRE #02195792) · REALTY EXPERTS® (CA DRE #00414413). Equal Housing Opportunity.
About the images. The header image is an illustration of a typical Union City street, generated with AI. It is not a photograph of any specific home, and no property shown is a listing. The aerial photograph above is by Pi.1415926535, CC BY-SA 3.0, via Wikimedia Commons.
Union City Homes I've Featured Lately
A few Union City homes I have recently written up, each with its own live market dashboard. Some may now be in contract or sold, so tap through for current status.
4339 Queensboro Way
Union City, CA 94587
$1,275,000
MLS# 41136880
3
Bed
2
Bath
1,357
Sq Ft
Sold $1,275,000 in July 2026. Read the full write-up and market dashboard.
Fully remodeled single-story Regency Park home with an updated chef's kitchen, remodeled baths, and a park-like backyard. No HOA. It sold in July 2026 for $1,275,000, from a $1,298,000 list price.
221 Dutra Vernaci Dr
Union City, CA 94587
$1,360,000
MLS# 41136164
4
Bed
2.5
Bath
2,000
Sq Ft
Sold $1,360,000 in July 2026. Read the full write-up and market dashboard.
Two-story Foothill Glen home with brand-new wide-plank floors, an open-concept great room, a primary suite with a soaking tub, and an upstairs laundry room. No HOA. It sold in July 2026 for $1,360,000, from a $1,399,900 list price.
See one you'd like to tour? I'd love to walk you through any of these, or anything else in the area.
Union City market questions, answered
What is the median home price in Union City right now?
The median sold price for a Union City single-family home was $1,363,000 in October 2026, according to the Bay East Association of REALTORS® and RPR market-trends report. That is down 2.3% from September and about level with October 2025. The median tracks the middle sale of the month, so it moves with the mix of homes that happened to close. The median price per square foot, which adjusts for size, rose 8% to $758 in the same month, and RPR's model estimate of the typical Union City home was $1,421,950, down 3% in a month and 2.8% in a year.
Is Union City a buyer's market or a seller's market in 2026?
It is still a seller's market, though a calmer one than in the spring. Union City finished October 2026 with 2.25 months of inventory, and the long-standing convention is that roughly six months of supply marks a balanced market, with anything well below that favoring sellers. Supply is up 31.6% from 1.71 months a year ago, the homes that sold had spent a median of 23 days on market, and the average sale closed at 100.22% of list. Buyers have more time and more room to negotiate than they did earlier in the year, but sellers still have the edge.
Are Union City homes still selling over asking price?
Barely. In October 2026 the average Union City single-family sale closed at 100.22% of list price, just above asking. That figure has fallen almost every month since February, when it was about 109%, and October's reading is the lowest since January 2024, based on the five-year chart in the Bay East and RPR report. A year ago it was about 102.6%. Well-priced homes in good condition can still draw more than one offer, but on average buyers are paying about the list price rather than well over it.
How long does it take to sell a home in Union City?
Homes that sold in October 2026 had spent a median of 23 days on market before going into contract, up 64% from about 14 days in September and the longest since August 2025. That figure measures listing to contract, not listing to closing, which usually adds about a month for escrow. Listings still active at the end of October had been on the market a median of 31 days. A home priced to the current market still sells in about three weeks; one priced above it now has time to sit.
How many homes sold in Union City in October 2026?
Twenty-two single-family homes closed in Union City in October 2026, up 57.1% from September. Thirty-two new listings came on the market, down 11.1%, 45 homes were active at month end, 21 went into contract during the month, and 15 were pending at the close of the month. Closings and new contracts rose while new listings fell, yet months of supply still edged up to 2.25, because the supply figure compares active listings with a rolling twelve-month average of new contracts.
Where can I get the full Union City market report?
The complete report is available as a free printable PDF on this page. It includes every median price across the pipeline, the months-of-supply dial, the current-month supply and demand counts, and five-year context bands showing where October sits against the last five years. You can also reach me directly at (510) 600-3425 or homes@HarvRealtor.com for an address-specific opinion of value for your own home.
Your Local Real Estate Team

Harv Balu
REALTOR® | GRI, CIPS, PSA, FTBS · REALTY EXPERTS®
CA DRE# 02195792
REALTY EXPERTS® · 41051 Mission Blvd, Fremont, CA 94539
Read every post in HarvRealtor, my free app, and the words read offline. Download it free from the App Store® (opens in new tab).