Union City Real Estate Market Report, August 2026: The Median Jumped, the Price Per Foot Did Not
Union City stayed firmly on the seller's side of the table in August 2026, but the month came with a genuine puzzle in it. The typical single-family home sold for $1,450,000, up 10.5% in a single month, and yet the median price per square foot fell 5.8% to $729. Both figures come from the same report, and both are correct. Understanding why they moved in opposite directions is most of what you need to know about this market right now.
Here is the complete picture, recreated from the Bay East Association of REALTORS® and RPR market-trends data, with a free branded PDF you can download and keep at the end.
August 2026 at a glance
Union City, CA, Single Family Residence, Median sold price $1,450,000, Sold-to-list 100.7%, Median 12 days on market, 1.71 months of inventory, 21 new listings, Median estimated value $1,474,840
The interactive dashboard below walks through every number, the median sold price, the months-of-supply dial, the full metric grid, and this month's supply and demand by stage.
The Union City market in August 2026
Single Family Residence citywide. All figures from the Bay East Association of REALTORS® / RPR market-trends report, data through August 2026.
Firmly seller's territory
Union City carried just 1.71 months of supply in August, well under the six-month mark that typically signals a balanced market, and firmly in seller's territory. Supply tightened again from last month (down about 12%), and homes closed at 100.7% of list in a median of 12 days. The premium over asking narrowed from July, so the speed is still there, but buyers are drawing the line closer to the list price.
The full market profile
The six price tiles share one $0 to $1.5M scale, so the bars compare directly. The two price per foot tiles sit on their own scale.
How many homes, how many buyers
The month's pipeline by stage. Every count is exact from the report; the full twelve-month trend lines are in the free PDF.
Twenty one homes came on and 36 sat active at month end, while 17 closed and 12 more went into contract. Months of inventory landed at 1.71, down about 12% from last month and down about 3% from a year ago, so even with far thinner activity on every line, the balance still sits firmly with sellers.
The headline number and the number that contradicts it
The median sold price rose to $1,450,000, up 10.5% from July. On its own that reads like a market accelerating hard into the end of summer.
The median price per square foot fell to $729, down 5.8%. On its own that reads like the opposite.
The resolution is that these two measures answer different questions. The median sold price reports the middle transaction of the month and nothing more, so it moves whenever the *kind* of home selling changes. Price per square foot adjusts for size, so it tracks the rate buyers paid rather than the totals they wrote.
When the total goes up while the rate goes down, the most direct explanation is that August's buyers closed on larger homes. The totals climbed because the houses were bigger, not because the market repriced upward. With only 17 closings in the month, it takes very few large sales to pull the median a long way.
This is why I never quote a single month's median as though it were the value of your home. It describes what sold, not what yours is worth.
Activity thinned out across every stage
The pipeline tells a consistent story, and it is one of volume rather than price:
- 21 new listings came on the market, down about 25% from July
- 36 homes were active at the end of the month
- 12 homes went into contract during August, down about 37%
- 11 homes were pending at month end
- 17 homes closed
Every stage moved the same direction. Fewer sellers listed, fewer buyers committed, fewer deals closed. Some of that is ordinary late-summer seasonality, when families are focused on the start of the school year rather than on moving. This year it was more pronounced than usual.
Thin volume is exactly the condition under which monthly medians get noisy, which brings us back to the point above.
Supply got tighter, not looser
It would be easy to read "fewer sales" as a cooling market. The supply figure says otherwise.
Months of inventory finished August at 1.71, down about 12.3% from July and down about 2.8% from a year ago. The long-standing convention holds that roughly six months of supply marks a balanced market, with less than that favoring sellers. At 1.71 months, Union City is nowhere near balanced.
The reason supply tightened even as sales fell is that listings fell faster than buyers did. Twenty one new listings against 12 new contracts is not a market being flooded with choice. For the month-by-month comparison, this is a step tighter than June's Union City report, and tighter still than May's.
The market split into fast and stuck
This is the most useful thing in the August data, and it is easy to miss because it lives in two separate numbers.
Homes that sold went under contract in a median of 12 days. Fast, and faster than July.
Homes still sitting on the market at month end had been listed a median of 43 days, up sharply from 29 days a month earlier.
Those are two different populations of homes. The market has not slowed down uniformly. It has divided. Correctly priced homes in good condition are still going quickly and still drawing competitive interest. Homes that missed on price, condition, or presentation are now sitting a month and a half, and the gap between those two outcomes widened during August.
The premium buyers paid over asking supports the same reading. Homes closed at 100.7% of list, still above asking but down from 102.1% in June. Buyers are still competing, and they are drawing the line closer to the list price than they were earlier in the year.
The pipeline hints at what closes next
One number worth watching: the median list price of homes that went newly pending in August was $1,473,944, up 5.7% and higher than both the median active list price of $1,381,444 and the $1,450,000 median that actually closed.
Homes going into contract were asking more than the ones already sitting on the market. That does not guarantee anything, contracts fall through and closing prices differ from asking prices, but it does suggest the next batch of closings is unlikely to come in soft.
Where August sits in a five-year view
Context matters more than any single month. Measured against the plotted five-year trend in the source report, from August 2021 through August 2026:
- Median sold price has ranged from roughly $970,000 to $1,620,000. August's $1,450,000 sits in the upper third, below the 2022 peak.
- Sold price per square foot has ranged from roughly $480 to $915. August's $729 sits around the middle, and eased from July.
- Sold to list price has ranged from roughly 94% to 116%. August's 100.7% is above the break-even line but far below the bidding-war highs of 2022.
Those band edges are approximate, read from the plotted five-year series in the source report. Each current value is exact.
What this means if you are selling
Price to the evidence, not to the headline. The $1,450,000 median went up because larger homes sold. If your home is not one of those, that number is not your number. A 43-day median on unsold inventory is what mispricing looks like in this market.
Your first two weeks are the whole game. Homes that sold did it in 12 days. That is when your listing has the attention of every active buyer with an alert set. Arriving overpriced spends that window and you rarely get it back.
Condition is doing real work. The widening gap between 12 days and 43 days is not random. It separates homes that presented well from homes that asked the buyer to do the imagining.
What this means if you are buying
You have a little more room than the headline suggests, but not much. At 1.71 months of supply you are still competing. That said, 100.7% of list is a materially different negotiation than 102.1%, and homes sitting 43 days are homes whose sellers are recalculating.
The 43-day listings deserve a look. Some are sitting because of price alone, and price is negotiable. Some are sitting because of a real defect, and that is what inspections are for. Sorting one from the other is where having someone walk them with you actually pays.
Do not over-read the median. If you concluded from a 10.5% jump that Union City just repriced, you would be bidding against a statistic rather than against the market.
Thinking about a move in Union City?
A market report tells the story of the whole city. To know what it means for your specific home or your next purchase, let's talk. I will put together a true, address-specific opinion of value based on the homes actually selling on your street, no pressure, no obligation. Call or text me at (510) 600-3425, or email homes@HarvRealtor.com. A couple of recent Union City homes I have written up: 4339 Queensboro Way and 221 Dutra Vernaci Dr.
**About the data.** Based on information from the Bay East Association of REALTORS® as of September 7, 2026. All figures describe the Union City single-family residential market citywide. Properties may or may not be listed by the office or agent presenting this information.
**Not a guarantee.** Market figures are from the Bay East Association of REALTORS® and Realtors Property Resource® (RPR®), deemed reliable but not guaranteed, and are not a prediction of future value. They describe the broader Union City single-family market and may not reflect any individual home. Harv Balu, REALTOR® (CA DRE #02195792) · REALTY EXPERTS® (CA DRE #00414413). Equal Housing Opportunity.
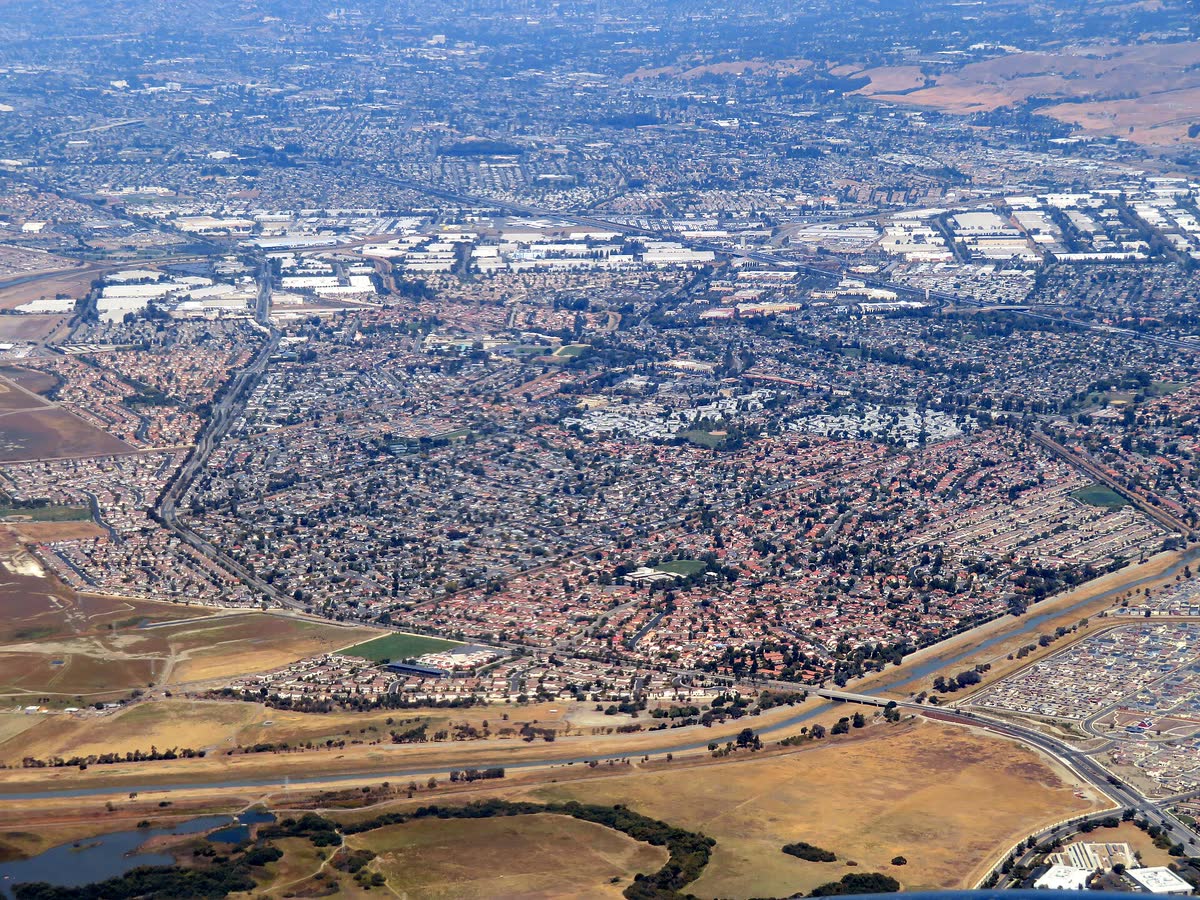
**Image credit.** Aerial view of Union City by Pi.1415926535, CC BY-SA 3.0, via Wikimedia Commons.
Union City Homes I've Featured Lately
A few Union City homes I have recently written up, each with its own live market dashboard. Some may now be in contract or sold, so tap through for current status.
4339 Queensboro Way
Union City, CA 94587
$1,275,000
MLS# 41136880
3
Bed
2
Bath
1,357
Sq Ft
Sold $1,275,000 in July 2026. Read the full write-up and market dashboard.
Fully remodeled single-story Regency Park home with an updated chef's kitchen, remodeled baths, and a park-like backyard. No HOA. It sold in July 2026 for $1,275,000, from a $1,298,000 list price.
221 Dutra Vernaci Dr
Union City, CA 94587
$1,360,000
MLS# 41136164
4
Bed
2.5
Bath
2,000
Sq Ft
Sold $1,360,000 in July 2026. Read the full write-up and market dashboard.
Two-story Foothill Glen home with brand-new wide-plank floors, an open-concept great room, a primary suite with a soaking tub, and an upstairs laundry room. No HOA. It sold in July 2026 for $1,360,000, from a $1,399,900 list price.
See one you'd like to tour? I'd love to walk you through any of these, or anything else in the area.
Union City market questions, answered
What is the median home price in Union City right now?
The median sold price for a Union City single-family home was $1,450,000 in August 2026, according to the Bay East Association of REALTORS® and RPR market-trends report. That is up about 10.5% from July. It is worth reading that number carefully, because the median tracks the middle sale in a given month, and in a month with only 17 closings the mix of homes that happened to sell moves it around a great deal. The median price per square foot, which adjusts for home size, actually fell 5.8% to $729 over the same period.
Is Union City a buyer's market or a seller's market in 2026?
It is still a seller's market. Union City finished August 2026 with 1.71 months of inventory, and the long-standing convention is that roughly six months of supply marks a balanced market, with anything meaningfully below that favoring sellers. Supply actually tightened about 12.3% from July and is down about 2.8% from a year ago. Homes also sold at 100.7% of list price in a median of 12 days, both signs of more ready buyers than available homes.
Why did the median price rise while price per square foot fell?
Because those two numbers answer different questions. The median sold price simply reports the middle transaction, so it moves when the type of home selling changes. The median price per square foot adjusts for size. When the median rises 10.5% while price per square foot falls 5.8%, the most straightforward reading is that August's buyers closed on larger homes than July's buyers did, so the totals went up even though the rate paid per foot went down. It reflects a change in what sold, not necessarily a change in what any individual home is worth.
How long does it take to sell a home in Union City?
Homes that sold in August 2026 went under contract in a median of 12 days. That said, the listings still sitting on the market at the end of August had been there a median of 43 days, up from 29 days the month before. Those two figures describe different groups of homes. Correctly priced, well-presented homes are still moving quickly, while homes that miss on price or condition are sitting considerably longer than they did earlier in the year.
How many homes sold in Union City in August 2026?
Seventeen single-family homes closed in Union City in August 2026, down from 28 in June. Twenty one new listings came on the market, 36 were active at month end, 12 went into contract during the month, and 11 were pending at the close of the month. Activity was thinner across every stage of the pipeline, which is typical of late summer but was more pronounced than usual this year.
Where can I get the full Union City market report?
The complete report is available as a free printable PDF on this page. It includes every median price across the pipeline, the months-of-supply dial, the current-month supply and demand counts, and five-year context bands showing where August sits against the last five years. You can also reach me directly at (510) 600-3425 or homes@HarvRealtor.com for an address-specific opinion of value for your own home.
Your Local Real Estate Team

Harv Balu
REALTOR® | GRI, CIPS, PSA, FTBS · REALTY EXPERTS®
CA DRE#
REALTY EXPERTS® · 41051 Mission Blvd, Fremont, CA 94539