Fremont Real Estate Market Report, June 2026 | Median Prices, Inventory & Trends
Fremont stayed firmly on the seller's side of the table in June 2026. The typical single-family home sold for $1,715,000, closed at 102.6% of its asking price, and went under contract in a median of just 11 days, all while supply held tight at 1.73 months. Here is the complete picture, recreated from the Bay East Association of REALTORS® and RPR market-trends data, with a free branded PDF you can download and keep at the end.
June 2026 at a glance
Fremont, CA, Single Family Residence, Median sold price $1,715,000, Sold-to-list 102.6%, Median 11 days on market, 1.73 months of inventory, 128 active listings, Median estimated value $1,800,350
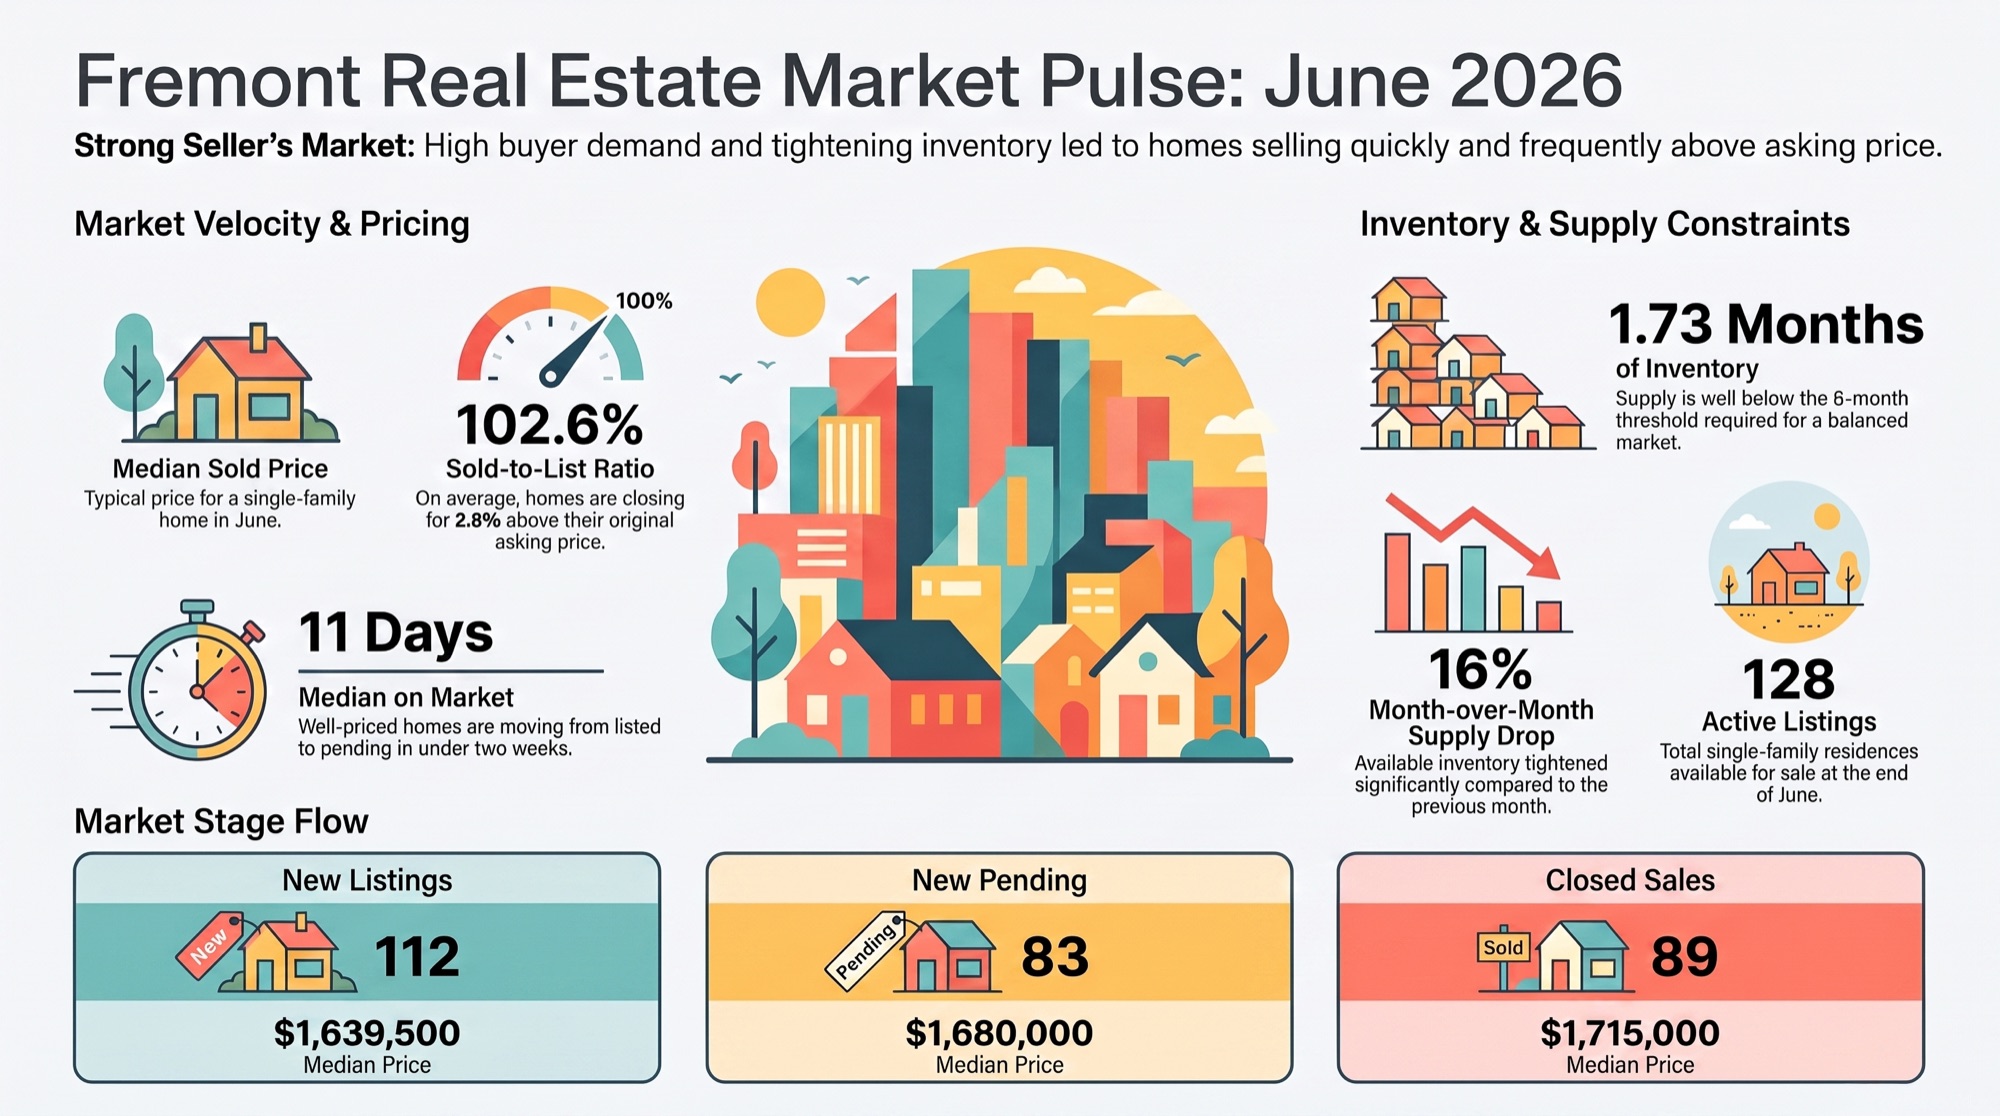
The interactive dashboard below walks through every number, the median sold price, the months-of-supply gauge, the full metric grid, and this month's supply and demand by stage.
The Fremont market in June 2026
Single Family Residence citywide. All figures from the Bay East Association of REALTORS® / RPR market-trends report, data through June 2026.
Firmly seller's territory
Fremont carried just 1.73 months of supply in June, well under the six-month mark that typically signals a balanced market, and firmly in seller's territory. Supply tightened sharply from last month (down about 16%), and with homes still closing near 102.6% of list in a median of 11 days, well-priced, move-in-ready homes continue to draw quick, competitive interest.
The full market profile
The six price tiles share one $0 to $1.9M scale, so the bars compare directly. The price per foot tile sits on its own scale.
How many homes, how many buyers
The month's pipeline by stage. Every count is exact from the report; the full five year trend context is in the free PDF.
A hundred and twelve homes came on and 128 sat active at month end, while 89 closed and 83 more went into contract. Months of inventory landed at 1.73, down about 16% from last month, so even with more choice for buyers the balance stayed firmly with sellers.
What the numbers are telling us
It is still a seller's market, and a tight one. Months of inventory finished June at 1.73, down about 16% from last month. Anything under three months is the classic marker of a seller's market, there are simply more ready buyers than there are homes to go around. Month over month this is a step tighter than last month's Fremont RPR report, and it lines up with the weekly, list-side view in my Fremont Altos market update.
Buyers are still paying over asking. A sold-to-list ratio of 102.6% means the typical Fremont home closed about 2.6% above its list price. Pair that with a median of 11 days on market and the message is clear: well-prepared, well-priced homes are still drawing competitive, fast offers.
June's closings ran above fresh asking. The median list price on brand-new June listings was $1,639,500, while the median closed sale settled higher at $1,715,000. When closings clear above where sellers are setting new asking prices, it is a sign that demand is still outrunning the supply of well-priced homes.
Estimated values have softened slightly. RPR's median estimated home value sits at $1,800,350, down 0.7% for the month and down 1.3% over the past year. Day-to-day sales stayed strong even as the broader valuation eased, a reminder that pricing to the live market still matters more than any single headline number.
Prices across the pipeline
Here is where prices sat at each stage of the Fremont market in June 2026:
- New listings, median list price $1,639,500 across 112 new homes
- Active, median list price $1,648,444 across 128 homes on the market
- New pending, median list price $1,680,000 across 83 fresh contracts
- Pending, median list price $1,607,475 across 68 homes awaiting close
- Sold, median sold price $1,715,000 across 89 closed homes
- Median price per square foot, $1,029 on closed single-family sales
The sold median sitting above the active and new-listing medians reflects a June closing mix tilted toward higher-priced, larger homes, which is normal month-to-month movement in a market this size.
Supply and demand this month
June brought 112 new listings, and 128 homes sat active at the end of the month. Meanwhile 83 homes went into contract, 68 were pending at month end, and 89 closed. With months of inventory at 1.73, that steady flow of buyers kept absorbing the homes coming up for sale, which is why supply stayed well under the three-month seller's-market line.
Get the full report, free
I put the entire month into a clean, printable PDF: every median price across the pipeline, the months-of-supply gauge, this month's supply and demand counts, and the five year price and value context, all in my own branding rather than a generic template.
Thinking about a move in Fremont?
A market report tells the story of the whole city. To know what it means for your specific home or your next purchase, let's talk. I will put together a true, address-specific opinion of value based on the homes actually selling on your street, no pressure, no obligation. Call or text me at (510) 600-3425, or email homes@HarvRealtor.com. If you are just getting started, my first-time buyer's guide for Fremont and my seller's guide walk through each side step by step, and the Fremont city guide is a good neighborhood-by-neighborhood overview.
Not a guarantee. Market figures are from the Bay East Association of REALTORS® and Realtors Property Resource® (RPR®), deemed reliable but not guaranteed, and are not a prediction of future value. They describe the broader Fremont single-family market and may not reflect any individual home. Harv Balu, REALTOR® (CA DRE #02195792) · REALTY EXPERTS® (CA DRE #00414413). Equal Housing Opportunity.
Your Local Real Estate Team

Harv Balu
REALTOR® | GRI, CIPS, PSA, FTBS · REALTY EXPERTS®
CA DRE# 02195792
REALTY EXPERTS® · 41051 Mission Blvd, Fremont, CA 94539
Read every post in HarvRealtor, my free app, and the words read offline. Download it free from the App Store® (opens in new tab).