Fremont CA Real Estate Market Update, May 2026 | Strong Seller's Market at MAI 64, $1.77M Median

Quick Take, May 2026
Here is where Fremont stands this week. Single-family homes only.
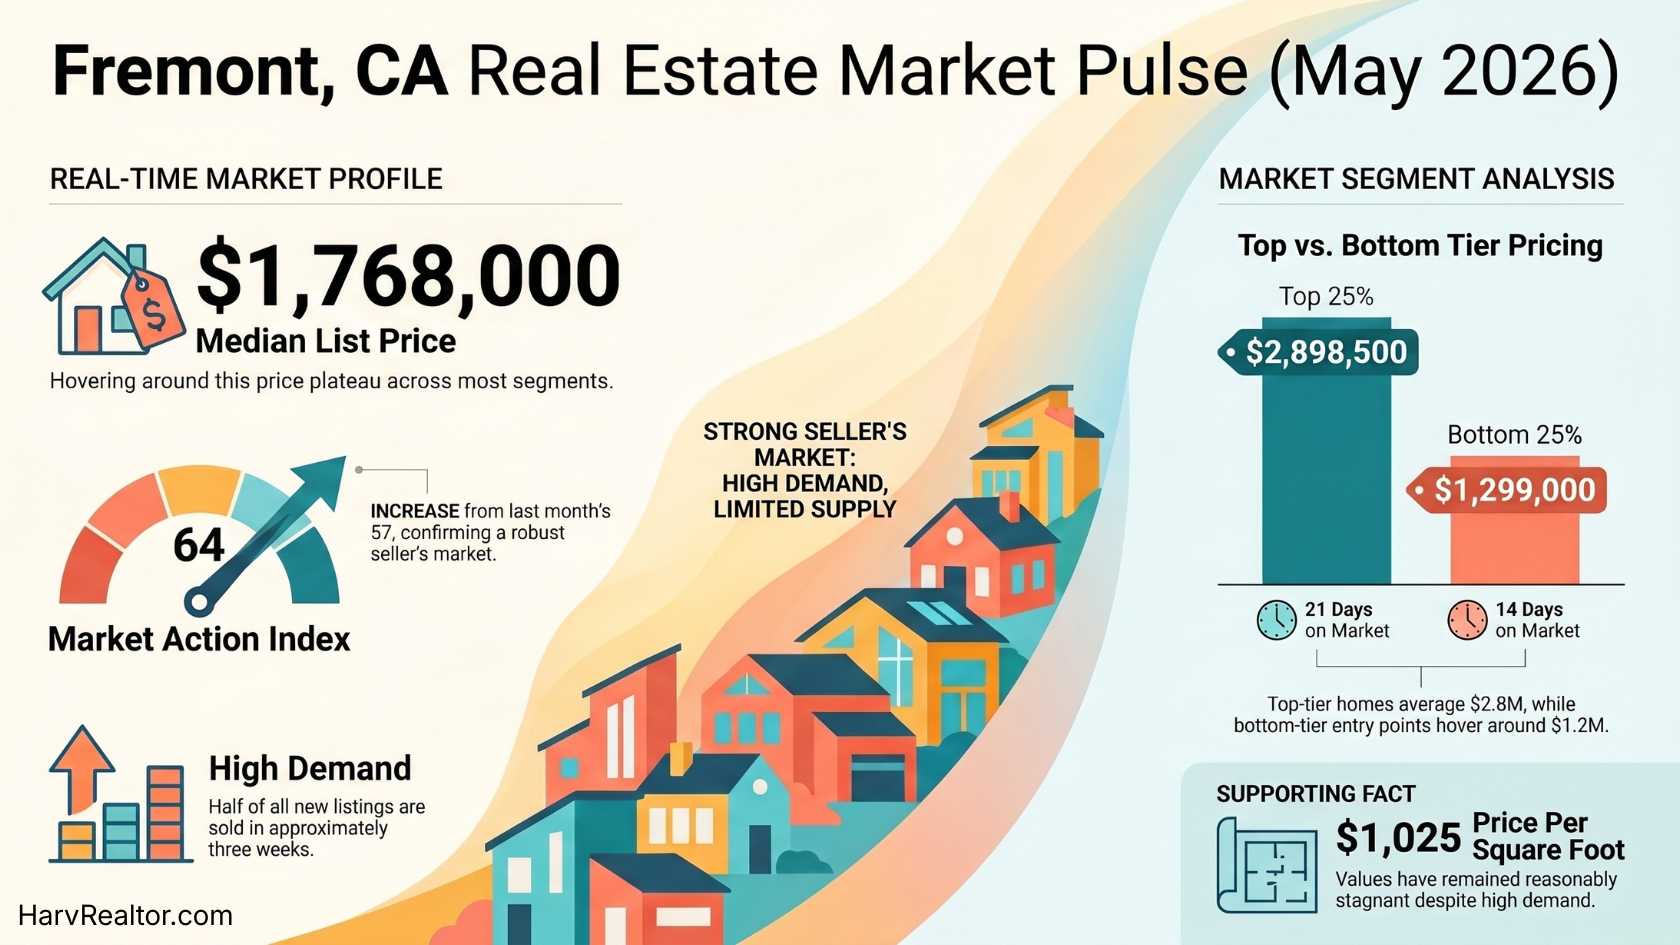
**Fremont CA is a strong seller's market.** Median list price is **$1,768,000**, the Market Action Index is **64 of 100** (up from 57 last month), there are **103** active listings citywide, and the typical home goes pending in **21 days**. Per square foot, the median is **$1,025**. Sellers still have leverage. Buyers have more options than they did six months ago, but they need to move fast on well-priced homes.
If you only have 60 seconds, that is the report. The interactive dashboard below has the full breakdown, including the 5-year trend chart and the four price tiers.
Fremont CA Market Snapshot, May 2026
Source: Altos Research, "Your Local Market Report" for Fremont, CA, single-family, report dated May 5, 2026. Captured by Harv Balu on May 4, 2026.
The Market Action Index measures the rate of sales versus inventory. Above 30 is a seller's market; above 50 is a strong seller's market.
This Week's Pulse
From the Altos Real-Time Market Profile5-Year Trend
Tap a tab to switch metric. Tap or hover the chart for a value.
Approximated from the Altos 90-day median chart. The current value of $1,768,000 is exact (page 2 of the PDF).
The Four Price Tiers, What You Get at Each
Each tier is roughly 25% of active inventoryAltos breaks the active listings into four equal-sized price bands. Tap any tier to expand for age, new listings, and absorbed counts.
Bring strategy, not just budget
- Pre-approval first. With MAI 64 and 21 day median, you need a fully underwritten pre-approval before touring, not just a pre-qualification letter.
- Watch the price-cut signal. 19% of listings have cut price at least once. Those are real negotiation opportunities.
- Pick a tier first. Every quartile has a different competitive picture. Entry tier ($1.3M) sells in 14 days; top tier ($2.9M) takes 21 plus.
- Lean into condition. Sellers in this market expect inspections. Bring the cleanest, fastest contract you can.
Price right, prep right, move fast
- Price for week one. The market is rewarding well-priced listings with 14 to 21 day pendings. Overprice, and you risk joining the 19% who cut later.
- Inventory is climbing. 103 active is up from earlier this winter. Buyers have more options. Stand out on prep, photos, and price.
- The relist tax is real. 17% of listings come back on. Coming back on means starting with a stale-listing handicap. Get it right the first time.
- Use the rent number. $4,195 median rent is your floor in a negotiation: a buyer who fails to close pays this much to wait. That cost is your leverage.
Is Fremont a Buyer's or Seller's Market in May 2026?
Short answer: strong seller's market.
The Market Action Index (MAI) is sitting at 64 of 100. Anything above 30 is technically a seller's market; above 50 is a strong seller's market; above 70 starts to look like a hot, multiple offers on everything market. At 64, Fremont is firmly in the strong seller's band, and trending up.
Here is the trajectory:
- Last month: MAI was 57.
- This week: MAI is 64.
- Direction: Rising.
What that means in plain English: more buyers are competing for the same set of homes than were doing so a month ago. If the trend continues, expect upward pressure on prices in the next several weeks.
What Is the Median Home Price in Fremont CA?
The current numbers, all single-family, citywide:
- Median list price: $1,768,000
- Median price of new listings: $1,549,000
- Median price per square foot: $1,025
The median list price has been plateauing since late 2024 in the high $1.7Ms to low $1.8Ms. It is not climbing rapidly, and it is not crashing. It is holding.
Price per square foot tells the same story: hovering around $1,025, gently up from $1,015 in late 2025 and roughly $950 in 2022. The long-term trajectory is up. The short-term trajectory is flat.
How Long Are Fremont Homes Sitting on the Market?
- Median days on market: 21 days
- Average days on market: 44 days
Half of Fremont single-family listings go pending in three weeks or less. The average is higher (44 days) because a small set of stale, overpriced, or unique listings drag the average up. The median is the better number for setting expectations.
For context, the median DOM has bounced between 8 days (peak market in 2023 and 2024) and 50 days (2022 correction). 21 days is right in the middle, normal for a healthy seller's market.
How Many Homes Are For Sale in Fremont Right Now?
103 active single-family listings citywide.
Inventory is up from the lows of late 2024 and early 2025 (roughly 50 to 70 active) but still well below the 2022 peak (around 150 active). The 90-day average is climbing.
What this means:
- For buyers: more selection than six months ago, especially in the entry and lower-middle tiers.
- For sellers: more competition. Pricing right and showing well matters more than it did last spring.
Important nuance from Altos: rising inventory by itself does not signal a weakening market. As long as the MAI keeps rising and DOM stays at 21 days, sellers still have the upper hand. Watch both numbers together.
Are Fremont Sellers Cutting Prices?
- Price decreased: 19% of active listings have cut their price at least once.
- Price increased: 2% have raised their price.
- Relisted: 17% are back on the market after coming off.
About 1 in 5 homes has had a price cut. That is the buyer's negotiation lane: those listings are real opportunities, and many were overpriced at launch. If you are working with a buyer's agent, ask for the price-history filter on every property before you tour.
The 17% relist rate matters too: those are listings that came off (canceled or expired) and went back up. The MLS sees them as stale. A relist is a tax on price.
The 2% who raised price are unusual. That is a signal of a seller who priced low to test demand and got a flood of interest.
What About Rent in Fremont?
Median single-family rent: $4,195 per month.
That is useful context for two reasons:
- Buy versus rent. A buyer who fails to close pays $4,195 a month to wait. That is a real cost.
- Investor math. At $4,195 rent on a $1,599,000 entry-tier home, you are looking at a gross-yield ratio that does not pencil out for cash flow on its own. Fremont is an appreciation play, not a cash-flow play. (Talk to a CPA before making investment decisions.)
The Four Price Tiers in Fremont, Where Do You Fit?
Altos splits active inventory into four equal-sized bands. Here is what each tier looks like as of May 2026:
Notable patterns:
- The entry tier moves fastest by absolute count. 10 new listings, 8 absorbed, 14 day median DOM. Buyer activity is heaviest here.
- The upper-middle tier moves quickly too. 14 day DOM, 5 absorbed of 6 new. Sellers are getting offers from discerning buyers.
- The top tier sits longer. 21 day DOM is normal for $2.9M plus homes; bigger price tags mean smaller buyer pools.
- Lot size matters. The two middle tiers compete on similar 4,500 to 6,500 sqft lots. The differentiator is square footage, age, and finish.
Buyer Playbook, How to Win in This Fremont Market
- Get fully underwritten before you tour. A pre-qualification letter is not enough. With MAI 64 and a 21 day median DOM, sellers will pick the cleanest, fastest contract. Get pre-approval with full underwriting.
- Stalk the price-cut signal. 19% of listings have already had a price cut. Filter every search for "price reduced" and "back on market." Those are your real opportunities.
- Pick your tier first, then your home. Each quartile competes differently. If you can stretch from $1.59M to $1.89M, you might find better value in the upper-middle band where buyer pools are smaller relative to absorption.
- Know your school assignment. Fremont's school assignments drive buyer demand. The Mission San Jose, Irvington, and Warm Springs zones command premiums. Verify the assigned school for any address before falling in love.
- Be ready to move in seven days. The well-priced listings go pending in seven to fourteen days. If you find one you like, write the offer that night. Hesitation is what costs Fremont buyers homes.
Seller Playbook, How to Maximize Your Fremont Sale
- Price for week one. The market is rewarding well-priced listings with 14 to 21 day pendings. Overprice, and you risk joining the 19% who cut later (and that cut shows up forever in your price history).
- Photograph like the home matters. With 103 active listings citywide, your home is competing for attention online before anyone walks in. Professional photos and a tight floor plan are the price of entry.
- Avoid the relist tax. 17% of listings come back on. The MLS treats a relist like a stale listing. Get the price and prep right the first time. Relists average longer DOM and lower sale-to-list ratios.
- Use the MAI uptrend. MAI is up from 57 to 64 in a month. If your timing is flexible, the next two to four weeks have momentum behind the seller's side. If you are debating "now versus fall," now is favorable.
- Have a buyer-side commission conversation upfront. Co-op commissions in California are negotiable, and most listing agents still publish a buyer-side commission to attract more offers. Talk through the structure before listing.
FAQs About the Fremont CA Real Estate Market
Is now a good time to buy a house in Fremont?
It depends on your goals. If you are a buyer with a five-plus-year horizon who can afford the monthly payment, yes, despite the seller's market. Fremont prices have plateaued, inventory is climbing, and the 19% price-cut rate gives well-prepared buyers real opportunities. If you are stretching financially or expect to move in 1 to 2 years, wait.
Are home prices going up in Fremont?
Slightly, on a long-term basis. The 90-day median list price is $1.77M, up from roughly $1.65M two years ago and $1.35M five years ago. Short-term, prices have plateaued for the last six months. The MAI rising from 57 to 64 suggests upward pressure may resume in the near future.
How fast do houses sell in Fremont CA?
Median: 21 days from listing to pending. Half of Fremont single-family listings go pending in three weeks or less. The average is 44 days due to a small group of stale or overpriced listings.
What is the median rent for a single-family home in Fremont?
$4,195 per month as of May 2026, citywide median.
Is Fremont a buyer's market or seller's market?
Strong seller's market. The Market Action Index is 64 of 100; above 50 is a strong seller's market.
How many homes are for sale in Fremont right now?
103 active single-family listings citywide as of May 5, 2026. Inventory is up from late-2024 lows but well below the 2022 peak.
What ZIP codes make up Fremont CA?
The four primary Fremont ZIP codes are 94536 (Centerville and Niles), 94538 (Irvington and Grimmer), 94539 (Mission San Jose and Warm Springs), and 94555 (Ardenwood). Each has its own micro-market dynamics. The Altos report above is citywide. For a ZIP-specific dashboard, see the Fremont 94538 RPR market dashboard I broke out for the Irvington area (the home featured on that page is no longer on the market, but the dashboard is still live).
Want a Personal Read for Your Address?
The Altos Research report is citywide. Your block, ZIP, and school assignment have their own micro-market dynamics. If you want a free, no-pressure pull of:
- Comps within 0.5 miles of your address
- Sale-to-list ratios for your specific ZIP
- Active competition in your tier
- The right price per square foot for your floor plan
Text Harv at (510) 600-3425 with your address. I'll pull the report for you, no obligation.
Buyer or Seller Contact
Harv Balu, REALTOR®
- Cell / Text: (510) 600-3425
- Email: homes@HarvRealtor.com
- Web: HarvRealtor.com
- REALTY EXPERTS®, 41051 Mission Blvd, Fremont, CA 94539
- DRE #02195792 · GRI · CIPS · PSA · FTBS
---
Disclosures
Information is deemed reliable but not guaranteed. The Market Action Index, median price, inventory, days on market, and rent figures in this post are sourced from the Altos Research "Your Local Market Report" for Fremont, CA, single-family, dated May 5, 2026, captured by Harv Balu on May 4, 2026. Trend lines on the 5-year chart are visually approximated from the Altos 90-day median series; current values are exact.
All measurements, school assignments, and any property-specific details mentioned here should be independently verified by the buyer or seller through disclosures, inspections, and due diligence. MLS and public-records data may contain errors or omissions and can change without notice.
This post is not financial, legal, or tax advice. Consult a licensed CPA, attorney, or financial planner for personal financial decisions.
Properties may or may not be listed by the office or agent presenting the information. This is not intended as a solicitation if your property is currently listed with another broker. Equal Housing Opportunity. REALTY EXPERTS® is independently owned and operated. © 2026 Harv Balu, REALTY EXPERTS®.
Your Local Real Estate Team

Harv Balu
REALTOR® | GRI, CIPS, PSA, FTBS · REALTY EXPERTS®
CA DRE# 02195792
REALTY EXPERTS® · 41051 Mission Blvd, Fremont, CA 94539