Fremont CA Housing Market Report, May 2026 | Median Sold $1.76M, Seller's Market, Free RPR Report Download
The 60-Second Read, Fremont in May 2026
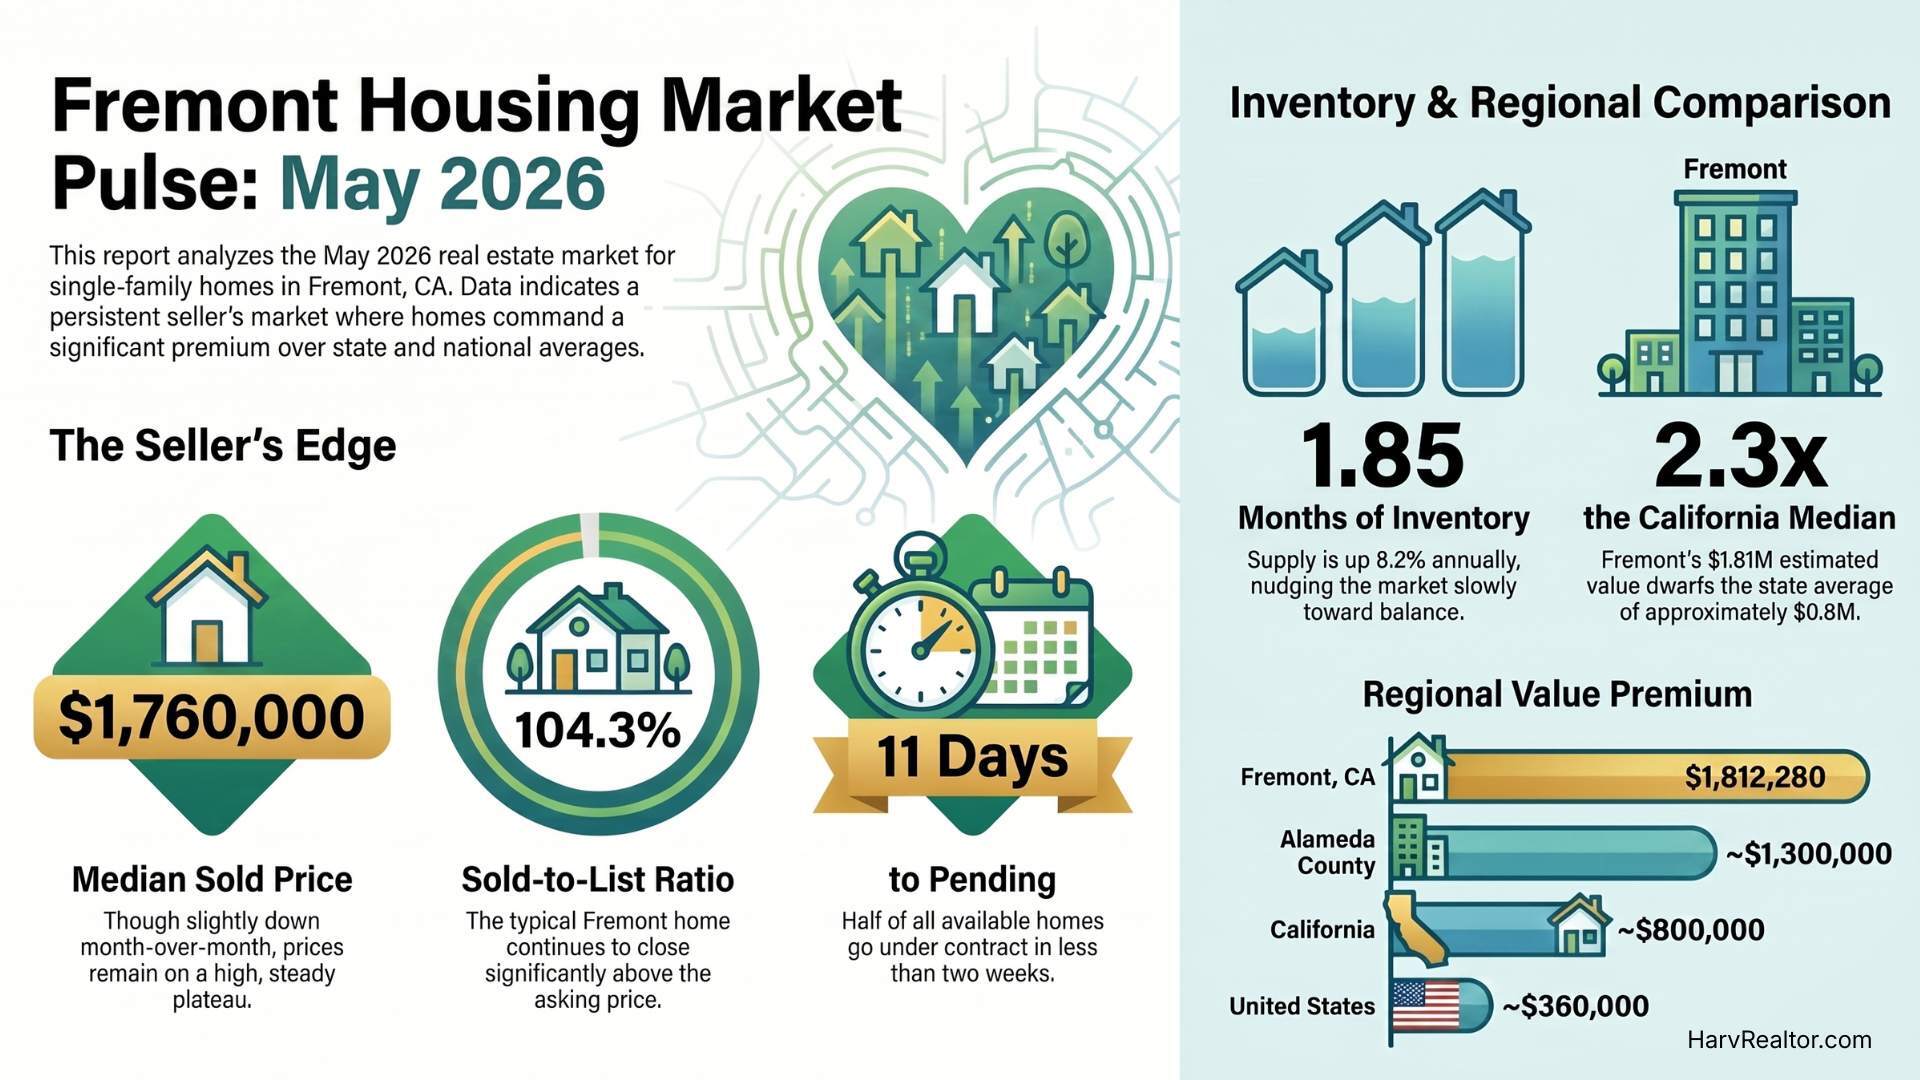
Fremont is a seller's market. Single-family homes, citywide: the median sold price is $1,760,000, there are just 1.85 months of inventory, homes are closing at 104.3% of list price, and the typical home goes pending in 11 days. RPR's estimated value of the median Fremont home is $1,812,280. Sellers still have the edge. Buyers have more to choose from than a year ago, and they need to move quickly on anything priced right.
This is the monthly closed-sales picture for Fremont, pulled from RPR (Realtors Property Resource), the REALTOR-owned database that draws on Bay East MLS and public records. If you want the weekly, list-side pulse instead, with the Market Action Index and the four price tiers, see my Fremont Altos market update for May 2026. This report is its closed-sales companion.
The interactive dashboard below has the full breakdown. Tap any chart to read a value.
Fremont CA Market Report, May 2026
Source: Realtors Property Resource (RPR), Bay East Association of REALTORS®. Single-family residence, citywide. Pulled June 8, 2026.
Market Type
Seller's MarketRPR places Fremont firmly on the seller's side of the scale. With only 1.85 months of inventory and homes selling above asking, sellers still hold the leverage, though rising supply is nudging the market toward balance.
The Market Pipeline, May 2026
How Fremont's single-family homes move from listed to sold. New listings come on, sit in active inventory, go pending, then close. Each card shows the median price, the number of homes, and the total dollar volume for that stage.
Five-Year Trend
Tap a tab to switch metric. Tap or hover the line for a value.
Trend line visually approximated from the RPR monthly chart for median sold price. The current value of $1,760,000 is exact.
Sales and Active Listings, Last 12 Months
Monthly active listings against closed sales. The gap between the two is the cushion of unsold inventory. Source: RPR, MLS data, single-family.
Fremont vs the Region, Median Home Value
RPR median estimated property value, May 2026. Fremont commands a large premium over the county, state, and national medians, and the gap has widened for more than a decade.
Fremont's figure is exact from the report. County, state, and national figures are read from the RPR comparison chart and are approximate.
Is Fremont a Buyer's or Seller's Market in May 2026?
Seller's market, clearly. RPR's own market-type gauge puts Fremont on the seller's side of the scale, and the supporting numbers back it up:
- Months of inventory: 1.85. Anything under three months is a seller's market. Under two is a tight one.
- Sold to list price: 104.3%. The average Fremont single-family home closed above its asking price.
- Median days to pending: 11. Half of all homes went under contract in less than two weeks.
The one thing moving in buyers' favor is supply. Inventory is up 9.5% from last month and 8.2% from a year ago. That is real, and it gives buyers a little more room. But 1.85 months is still a long way from the five to six months that would make this a balanced market.
What Is the Median Home Price in Fremont CA?
It depends on which number you want, and they tell slightly different stories. All figures are single-family, citywide, May 2026:
- Median sold price: $1,760,000. What actually closed. Down 5.4% from the prior month, which is month-to-month noise in a market this size, not a trend.
- Median estimated value: $1,812,280. RPR's model value for the typical Fremont home. Up 0.5% on the month, down 1.4% on the year.
- Median list price, active: $1,699,000. What is on the market right now.
- Median list price, new: $1,746,944. What sellers are asking on fresh listings.
Put together, the picture is a market that has plateaued at a high level. Prices are not climbing fast, and they are not falling. The five-year trend chart in the dashboard tells the story: a run-up into 2022, a dip through the rate shock of late 2022, a recovery, and then a high plateau from 2024 into 2026.
How the Fremont Market Pipeline Works
The dashboard breaks the market into four stages. Here is how to read them, and what each is telling you in May 2026:
- New listings: 136 homes, median ask $1,746,944. New supply coming on. The count is down 22.3% from last month, normal seasonal cooling heading into summer.
- Active listings: 133 homes, median ask $1,699,000. What a buyer can tour today. Up 4.7% on the month, the rising-inventory story.
- Pending: 74 homes, median ask $1,673,500. Under contract, waiting to close. Down 19.6%, which tracks the lower new-listing count.
- Sold: 97 homes, median sold $1,760,000. Closed during the month. Up 16.9%, a strong absorption month.
The takeaway: more homes closed than went pending, and the sold count jumped while new listings cooled. That is a market still clearing its inventory efficiently, even as the active count ticks up.
Are Fremont Homes Selling Above Asking?
Yes, on average. The sold-to-list ratio is 104.31%, meaning the typical closed sale came in about 4.3% over the asking price. On a $1.7M home, that is roughly $73,000 over list.
That number has eased slightly, down 1.1% from the prior month, which fits the rising-inventory theme. But a city closing above asking, in a median of 11 days, is not a market where buyers are calling the shots.
Price per square foot tells the same story: $1,045 median for closed single-family sales, essentially flat (down 0.9% on the month). It has held in the $1,045 to $1,150 band since 2024.
How Much Inventory Is on the Market in Fremont?
There are 133 active single-family listings, which works out to 1.85 months of supply.
Months of supply is the cleaner number to watch, because it accounts for how fast homes are selling, not just how many are listed. At 1.85 months, if no new homes came on the market, Fremont would sell through its entire active inventory in under two months.
That figure is up 9.5% on the month and 8.2% on the year. The trend is toward balance, slowly. The 12-month bar chart in the dashboard shows the seasonal rhythm clearly: listings peaked last summer around 138 to 143, bottomed in December near 41, and have climbed back to 133 in May as the spring market opened up.
See the Homes Behind the Numbers
This report is a snapshot of where Fremont stood in May 2026. For the homes on the market today, here is every active Fremont single-family listing, updated live from the MLS as new homes come on and others go pending.
How Does Fremont Compare to the Rest of California?
Fremont is expensive, and it has been pulling away from the rest of the state for over a decade. The RPR median estimated value comparison:
- Fremont: $1,812,280.
- Alameda County: about $1.3M.
- California: about $0.8M.
- United States: about $0.36M.
The typical Fremont home is worth roughly 2.3 times the California median and about 5 times the national median. The drivers are familiar: top-rated schools, proximity to Silicon Valley employers, the Tesla plant, and a fixed supply of land hemmed in by the bay and the hills. That premium is the reason Fremont tends to hold value through cycles that hit cheaper markets harder.
What This Means If You Are Buying in Fremont
- Get fully underwritten before you tour. With homes going pending in 11 days and closing over asking, a pre-qualification letter is not enough. Bring a fully underwritten pre-approval so your offer is the cleanest one on the table.
- Use the rising inventory. There are more active listings than there were a year ago. You have a little more room to be selective, and a little more room to negotiate on homes that have sat. Ask your agent to filter for price reductions and longer days on market.
- Know your school assignment before you fall in love. Fremont school boundaries drive value. The Mission San Jose, Irvington, and Warm Springs zones command premiums. Verify the assigned schools for any address.
- Pick your ZIP. Fremont's four ZIPs behave differently, and the citywide median can hide that.
For a ZIP-level read on Fremont 94538, see the Fremont 94538 RPR market dashboard I broke out for the Irvington area (the home featured on that page is no longer on the market, but the ZIP-level dashboard is still live). If this is your first purchase here, my first-time buyer's guide for Fremont walks through the whole process step by step.
What This Means If You Are Selling in Fremont
- Price for the first two weeks. The market is rewarding well-priced homes with offers over asking in under two weeks. Overprice, and you give that momentum away. The homes that sit are usually the ones that chased the last comp up.
- Prep and photos still matter. With 133 active listings, your home competes for attention online before anyone walks through it. Professional photos and a clean presentation are the price of entry, not a luxury.
- The over-asking premium is real, but earned. Homes are closing at 104.3% of list, but that is the reward for pricing right and showing well, not a free gift to every listing.
- Time it with the spring. Inventory and buyer activity are both climbing into summer. If your timing is flexible, listing into an active market with tight supply works in your favor.
For a full pricing and prep strategy, see my Fremont seller's guide, and for a neighborhood-by-neighborhood overview of the city, the Fremont city guide is a good place to start.
The Full 15-Page Fremont Report, Free
The dashboard above is the highlight reel. The full RPR report has every chart: new, active, pending, and sold trends going back five years, total dollar volume by stage, the months-of-supply history, the sold public-records series, and the side-by-side of median price against listing counts. Grab it here.
Frequently Asked Questions About the Fremont Market
Is Fremont CA a buyer's or seller's market in May 2026?
Seller's market. There are just 1.85 months of inventory, single-family homes are selling at 104.3% of list price, and the median home goes pending in 11 days. Supply is rising, up 9.5% on the month and 8.2% on the year, which is nudging the market toward balance, but sellers still hold the leverage.
What is the median home price in Fremont CA in May 2026?
Per RPR, single-family and citywide, the median sold price is $1,760,000 and the median estimated value is $1,812,280. The median list price is $1,699,000 on active listings and $1,746,944 on new listings.
How fast are homes selling in Fremont CA?
The median time to pending is 11 days, and single-family homes are closing at an average of 104.31% of list price. Well-priced homes that show well still draw offers at or above asking.
How much inventory is available in Fremont CA?
Fremont has 133 active single-family listings and 1.85 months of supply. Inventory is up 9.5% on the month and 8.2% on the year, but anything under three months is still seller's territory.
What is the price per square foot in Fremont in 2026?
The median is $1,045 for closed single-family sales, down about 0.9% on the month. It has held between roughly $1,045 and $1,150 since 2024.
How does Fremont compare to the rest of California?
Fremont's median estimated value of $1,812,280 sits well above the roughly $1.3M Alameda County median, the roughly $0.8M California median, and the roughly $0.36M national median. Fremont has pulled away from those benchmarks for more than a decade.
Want a Read on Your Specific Block?
This report is citywide. Your street, your ZIP, and your school assignment each have their own micro-market. If you want a free, no-pressure pull of comps within half a mile of your address, the right price per square foot for your floor plan, and what is actually selling in your tier, text me your address and I will pull it for you.
Buyer or Seller Contact
Harv Balu, REALTOR®
- Cell or text: (510) 600-3425
- Email: homes@HarvRealtor.com
- Web: HarvRealtor.com
- REALTY EXPERTS®, 41051 Mission Blvd, Fremont, CA 94539
- DRE #02195792, GRI, CIPS, PSA, FTBS
Disclosures
The figures in this post are from the Realtors Property Resource (RPR) market report for Fremont, California, single-family residence, Bay East Association of REALTORS®, pulled by Harv Balu on June 8, 2026, for the May 2026 data period. Headline figures, the listing pipeline, and the 12-month sales and listings chart are exact from the report. The multi-year trend lines are visually approximated from the RPR monthly charts; the current value on each is exact. Regional comparison figures for Alameda County, California, and the United States are read from the RPR comparison chart and are approximate; Fremont's is exact.
Information is deemed reliable but not guaranteed. All figures are point-in-time and subject to revision. Real estate data may contain errors or omissions and can change without notice. This post is not financial, legal, or tax advice. Consult a licensed professional for personal decisions.
Properties may or may not be listed by the office or agent presenting this information. This is not a solicitation if your property is currently listed with another broker. Equal Housing Opportunity. REALTY EXPERTS® is independently owned and operated. © 2026 Harv Balu, REALTY EXPERTS®.
Your Local Real Estate Team

Harv Balu
REALTOR® | GRI, CIPS, PSA, FTBS · REALTY EXPERTS®
CA DRE# 02195792
REALTY EXPERTS® · 41051 Mission Blvd, Fremont, CA 94539