Hayward Real Estate Market Report, August 2026: A $935,000 Median, and Two Markets Inside It
Hayward stayed on the seller's side of the table in August 2026. The typical single-family home sold for $935,000, at 102.2% of its list price, in a median of 16 days. Underneath those headline figures, though, the month carried three separate stories, and each one matters more than the headline if you are about to buy or sell here.
The median rose while the price per square foot fell. Supply held steady on the month but is building on the year. And the homes buyers signed on are priced very differently from the homes still waiting.
Here is the complete picture, recreated from the Bay East Association of REALTORS® and RPR market-trends data for Hayward as a whole, with a free branded PDF you can download and keep at the end.
August 2026 at a glance
Hayward, CA, Single Family Residence, citywide. Median sold price $935,000, Sold-to-list 102.2%, Median 16 days on market, 2.38 months of inventory, 43 closed sales, Median estimated value $919,400
The interactive dashboard below walks through every number: the median sold price, the months-of-supply dial, where buyers signed against what is still waiting, the full metric grid, and this month's supply and demand by stage.
The Hayward market in August 2026
Single Family Residence, citywide Hayward. Not condos or townhomes, and not a single ZIP code.
All figures from the Bay East Association of REALTORS® / RPR market-trends report, data through August 2026.
Seller's territory, with more room than a year ago
Hayward carried 2.38 months of supply in August, well under the six-month mark that typically signals a balanced market. It held about steady from July (down 1.2%) but sits 17.8% higher than a year ago, near the top of its five-year range. Homes still closed at 102.2% of list in a median of 16 days, so sellers keep the edge, and buyers have more to choose from than they did last summer.
Where buyers signed, and what is still waiting
Homes that went into contract in August against homes still on the market at month end, from the same report.
Higher median list price on the homes still waiting, and more than twice the days. A gap between two groups of homes, not a verdict on any one of them.
The full market profile
The six price tiles share one $0 to $1M scale, so the bars compare directly. The two price per foot tiles sit on their own scale.
How many homes, how many buyers
The month's pipeline by stage. Every count is exact from the report; the five-year trend lines are in the free PDF.
Sixty seven homes came on and 100 sat active at month end, while 43 closed and 44 more went into contract. Contracts rose 10% from July while active inventory fell 5.7%, so August absorbed homes faster than it added them. Months of inventory landed at 2.38, about level with July and up 17.8% from a year ago.
The median rose, and the price per square foot fell, in the same month
The median sold price rose to $935,000, up 5.6% from July. Read on its own, that sounds like Hayward repricing upward into the fall.
The median sold price per square foot fell to $608, down 8.2%. Read on its own, that sounds like the opposite.
Both are correct. The median sold price reports the middle sale of the month and nothing more, so it moves whenever the *kind* of home selling changes. Price per square foot adjusts for size, so it tracks the rate buyers actually paid. When the total goes up while the rate goes down, the most direct explanation is that August's closings skewed toward larger homes.
A third number from the same report backs that reading. RPR's median estimated value for Hayward homes was $919,400, down 1.8% from July and down 2% from a year ago. That is a model estimate, not an appraisal, but it measures the whole housing stock rather than only the homes that happened to close, and it did not rise.
Union City showed the same shape in the same month: its August median jumped 10.5% while its price per foot fell. Two neighboring cities moving this way at once points to what sold, not to a repricing.
This is why I never quote one month's median as the value of your home. It describes what sold, not what yours is worth.
Buyers stepped up in August, and they absorbed homes faster than sellers added them
The pipeline tells a clear story this month:
- 67 new listings came on the market, up 4.7% from July
- 100 homes were active at the end of the month, down 5.7%
- 44 homes went into contract during August, up 10%
- 43 homes were pending at month end, up 10.3%
- 43 homes closed, up 2.4%
New contracts rose faster than new listings, and the pool of active homes shrank. In a late-summer month that often runs quiet, Hayward buyers were more active than in July, not less.
Supply held steady on the month, and it is building on the year
Months of inventory finished August at 2.38, down just 1.2% from July. On a month-over-month basis, that is flat.
The year-over-year number is the one worth watching. Supply is 17.8% higher than it was in August 2025, and on the report's five-year chart it sits near the top of its range, roughly double where it stood in August 2021. Hayward has more homes available relative to its pace of sales than at almost any point in the last five years.
That still leaves Hayward well inside seller's territory. The long-standing convention holds that roughly six months of supply marks a balanced market, and 2.38 months is nowhere near it. What has changed is the margin. Sellers keep the advantage, with less room to spare than they had a year or two ago.
Two speeds: where buyers signed, and what is still waiting
This is the most useful thing in the August data, and it takes three numbers to see it.
The homes that went into contract in August carried a median list price of $898,444 and took a median of 15 days to get there.
The homes still on the market at month end carried a median list price of $989,394 and had been listed a median of 32 days.
That is a gap of $90,950 in median list price, with more than twice the time on market. The two groups differ in more than price, so the gap is not proof that price alone explains the wait. Size, location and condition all vary between them. But the pattern is consistent across the pipeline. New listings came on at a median of $899,000, new contracts at $898,444, and homes pending at month end at $898,000. Three medians within about $1,000 of each other describe where Hayward buyers are actually committing.
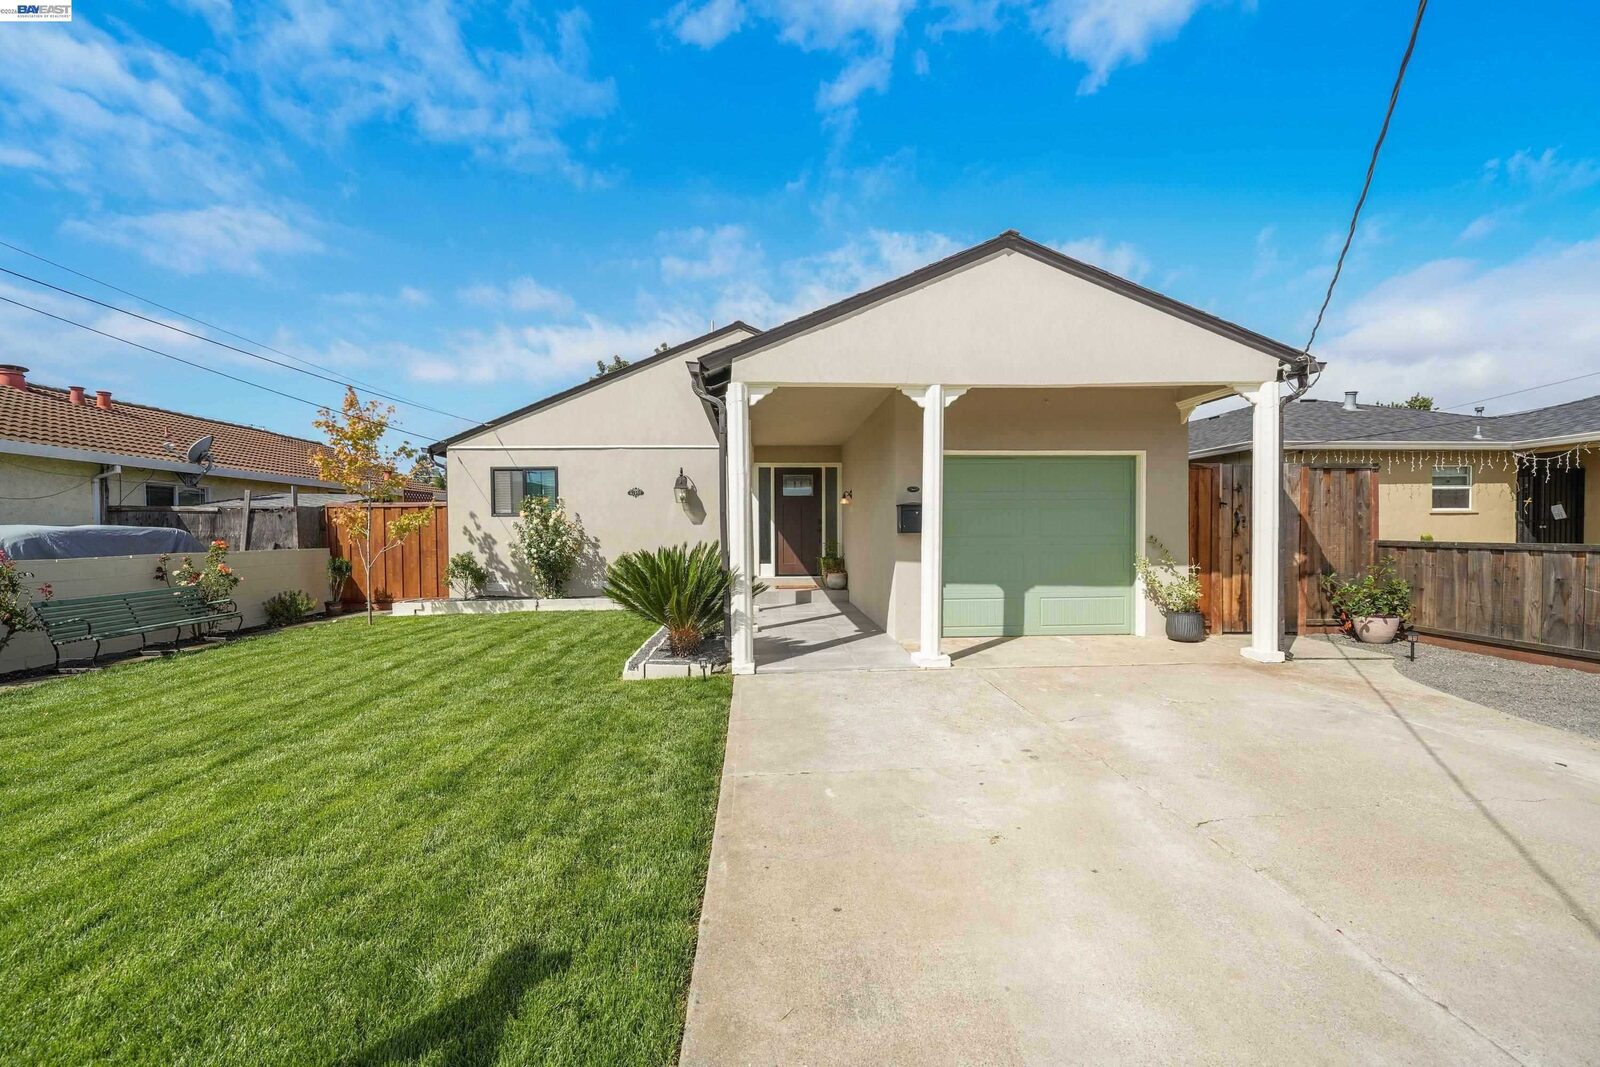
For a concrete example, the 31967 Albany St open house I am hosting on September 26 and 27 is listed at $898,000, right in that band.
Where August sits in a five-year view
Context matters more than any single month. Measured against the plotted five-year trend in the source report, from August 2021 through August 2026:
- Median sold price has ranged from roughly $835,000 to $1,125,000. August's $935,000 sits about a third of the way up that range, well under the spring 2022 peak and roughly level with August 2025.
- Sold price per square foot has ranged from roughly $575 to $725. August's $608 sits near the bottom, and the five-year low came as recently as January 2026.
- Sold to list price has ranged from roughly 97.6% to 118.5%. August's 102.2% is above the break-even line and far below the bidding-war highs of early 2022.
- Months of supply has ranged from roughly 0.5 to 2.6. August's 2.38 sits near the top.
Those band edges are approximate, read from the plotted five-year series in the source report. Each current value is exact.
What this means if you are selling in Hayward
Price into the band where buyers are signing. In August that band was right around $900,000 at the median. Every listing is different, and your number comes from the homes that sold on your street, not from a citywide median. But a list price well above what comparable homes are going into contract at is what the 32-day column looks like.
Your first two weeks are the whole game. Homes that went into contract did it in a median of 15 days. That window is when every active buyer with a saved search sees your home for the first time. Coming out overpriced spends it, and you rarely get it back.
More competition from other sellers than last year. With supply up 17.8% on the year, a buyer touring your home is more likely to have seen two or three others that week. Presentation and condition carry more weight than they did in 2022. If you are also weighing the cost side, I broke down what it really costs to sell a home in the Bay Area, line by line.
What this means if you are buying in Hayward
You have more choice than you did a year ago. A 17.8% year-over-year rise in supply is real room, and the 100 homes active at the end of August give you something to compare against.
Well-priced homes still go over asking. Homes closed at 102.2% of list in a median of 16 days. If a home is priced in the band where buyers are signing and it shows well, expect competition and plan your offer accordingly.
The homes that have been sitting deserve a look. A home listed for a month or more has a seller who is recalculating. Some are sitting because of price, and price is negotiable. Some are sitting because of something an inspection will find. Sorting one from the other is where walking them with someone local pays off.
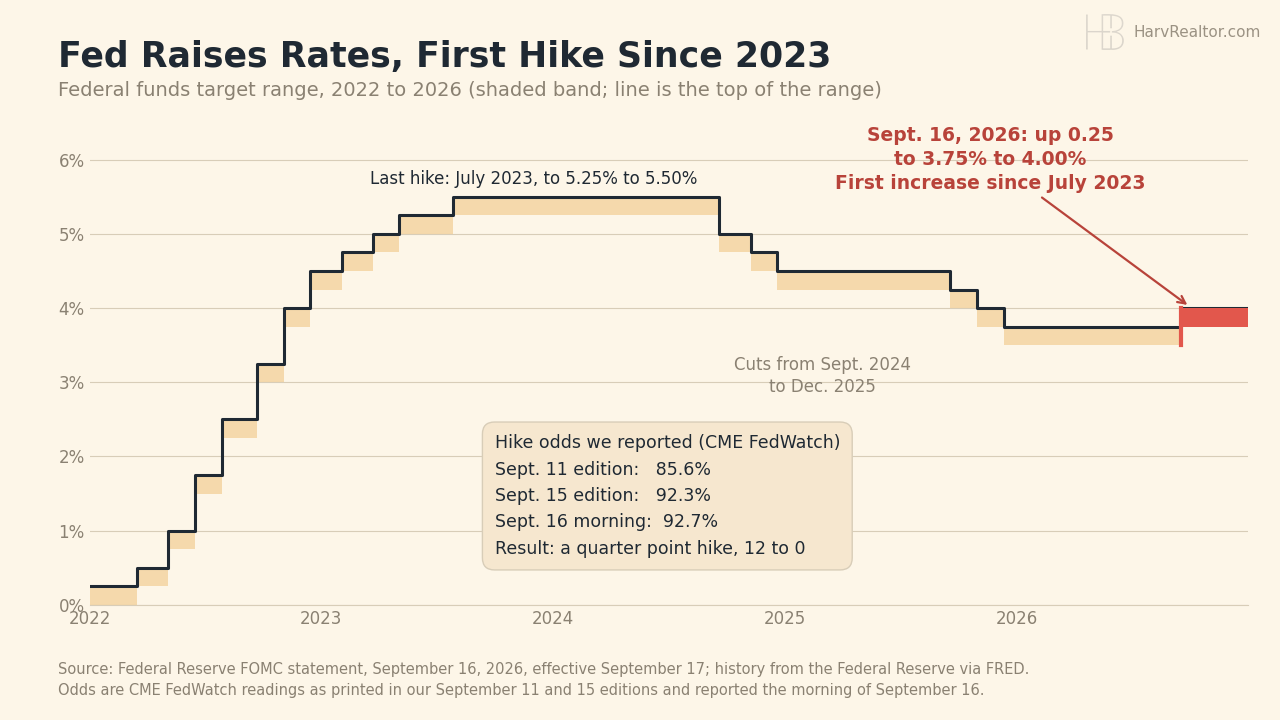
Rates are part of the math. The Fed moved on September 16, and I walked through what the Fed's first rate hike since 2023 means for Bay Area buyers, including what it did and did not do to mortgage rates.
How Hayward compares with its neighbors
Hayward is a very different price point from the cities around it. The same report series put Union City's August median at $1,450,000, about $515,000 above Hayward's $935,000 in the same month. Neighborhoods, lot sizes and housing stock differ a great deal across that line, so the comparison is about price points, not like-for-like homes. For more on the city itself, from the hills to the shoreline, see my Hayward city guide.

Photo by Mercurywoodrose, CC BY-SA 3.0, via Wikimedia Commons.
One note on scope. Every figure in this report covers single-family homes across the whole city of Hayward. My 31967 Albany St write-up quotes figures for ZIP code 94544 only, a smaller area with its own supply picture, so its numbers will not match these, and they are not meant to.
Thinking about a move in Hayward?
A market report tells the story of the whole city. To know what it means for your specific home or your next purchase, let's talk. I will put together a true, address-specific opinion of value based on the homes actually selling near you, with no pressure and no obligation. Call or text me at (510) 600-3425, or email homes@HarvRealtor.com.
Harv Balu, REALTOR®
- Cell / Text: (510) 600-3425
- Email: homes@HarvRealtor.com
- Web: HarvRealtor.com
- REALTY EXPERTS® · 41051 Mission Blvd, Fremont, CA 94539 · DRE #02195792
---
Disclosures & Disclaimers
Based on information from the Bay East Association of REALTORS® and Realtors Property Resource® (RPR®) market-trends report for Hayward, California, Single Family Residence, citywide, generated September 23, 2026, with data through August 2026. All figures describe the Hayward single-family market as a whole at every size and condition, not condominiums or townhomes, and not any individual ZIP code or property. Properties may or may not be listed by the office or agent presenting this information.
Figures are deemed reliable but not guaranteed, are subject to revision by the source, and are not a prediction of future value. Five-year ranges are approximate, read from the plotted trend charts in the source report; each current value is exact. The $90,950 list-price gap is computed from two figures in the same report. The median estimated value is an automated model estimate, not a formal appraisal. Nothing here is an appraisal or a valuation of any specific property. Harv Balu is a licensed REALTOR®, not a lender, attorney, or CPA, and does not provide legal, tax, or lending advice. This is not intended as a solicitation if your property is currently listed with another broker.
31967 Albany St is listed by Steve Dhilon, REALTY EXPERTS®. Harv Balu is hosting the September 26 and 27, 2026 open house and is not the listing agent. Price and availability can change at any time.
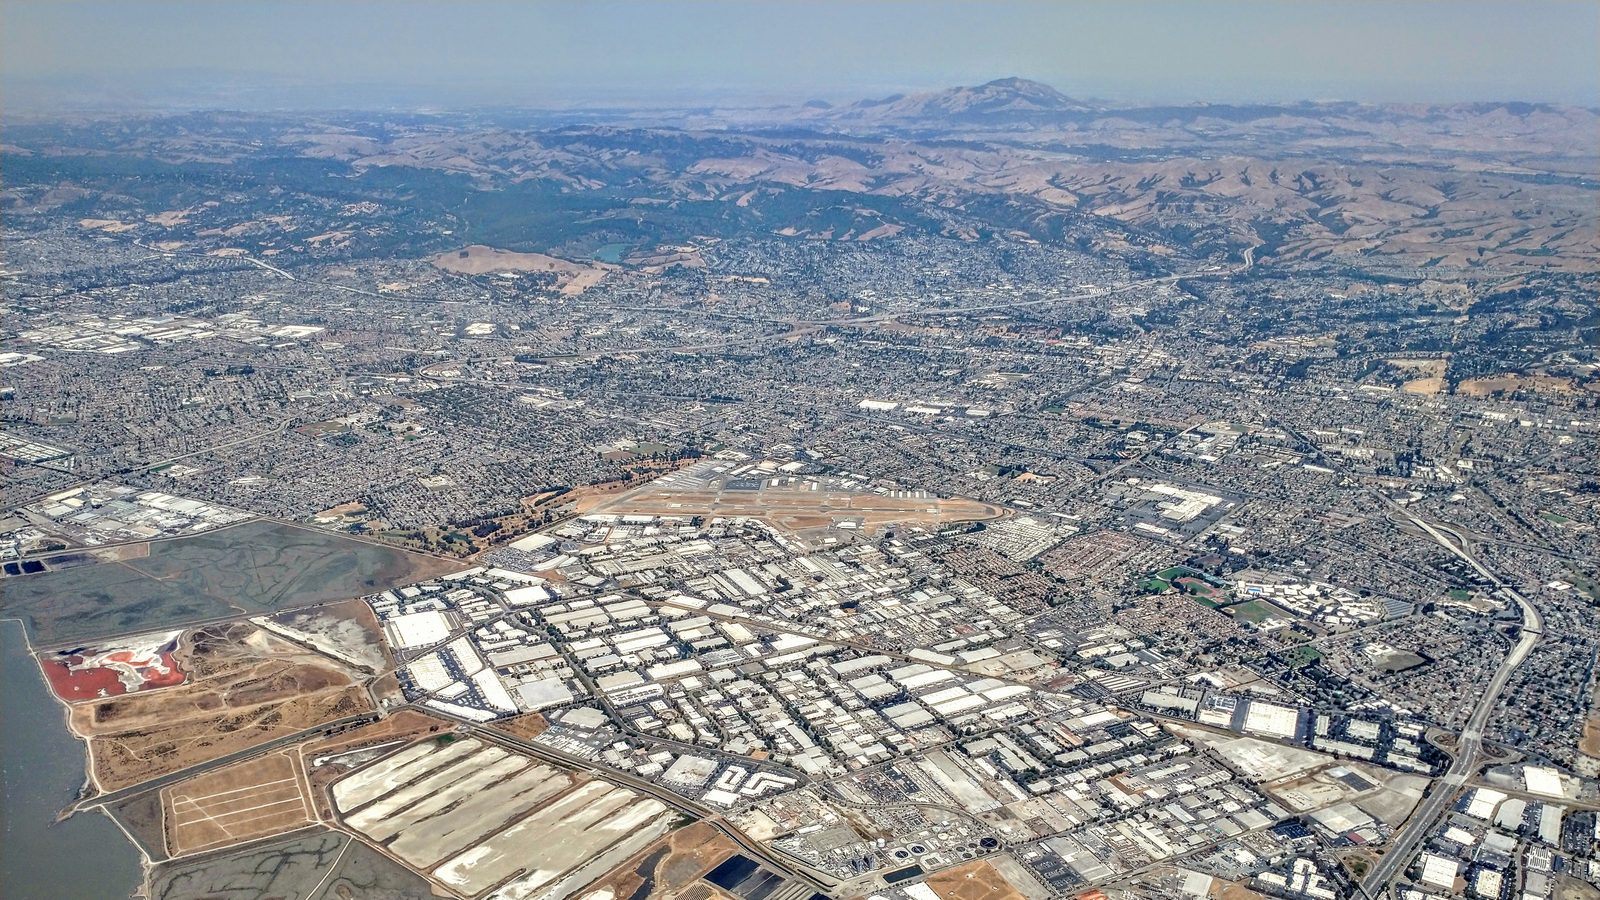
Header photo: "Aerial view of Hayward in 2021" by Alfred Twu, CC0, via Wikimedia Commons, looking north across Hayward toward the East Bay hills and Mount Diablo. Cropped and color adjusted. Garden photo: "Japanese Gardens trail Hayward" by Mercurywoodrose, licensed CC BY-SA 3.0 (creativecommons.org/licenses/by-sa/3.0), via Wikimedia Commons. Cropped and resized.
Equal Housing Opportunity. Harv Balu, CA DRE #02195792. REALTY EXPERTS® (CA DRE #00414413) is independently owned and operated. © 2026 Harv Balu, REALTY EXPERTS®.
Hayward market questions, answered
What is the median home price in Hayward right now?
The median sold price for a Hayward single-family home was $935,000 in August 2026, according to the Bay East Association of REALTORS® and RPR market-trends report for the city as a whole. That is up about 5.6% from July. Read it alongside two other figures from the same report. The median price per square foot fell 8.2% to $608, and RPR's median estimated value for Hayward homes was $919,400, down 1.8% from July and 2% from a year earlier. Taken together, August's higher median reflects which homes sold more than any citywide rise in value.
Is Hayward a buyer's market or a seller's market in 2026?
It is still a seller's market. Hayward finished August 2026 with 2.38 months of inventory, and the long-standing convention is that roughly six months of supply marks a balanced market, with anything meaningfully below that favoring sellers. Homes also closed at 102.2% of list price in a median of 16 days. The change worth knowing is on the supply side: inventory held about steady from July but is 17.8% higher than a year ago, and it sits near the top of its five-year range. Sellers keep the edge, and buyers have more choice than they did last summer.
Why did Hayward's median price rise while price per square foot fell?
Because the two numbers answer different questions. The median sold price reports the middle transaction of the month, so it moves whenever the kind of home selling changes. Price per square foot adjusts for size. When the median rises 5.6% while price per square foot falls 8.2%, the most direct reading is that August's closings skewed toward larger homes, so the totals went up while the rate paid per foot went down. RPR's estimated value, down 1.8% on the month, points the same way. It describes what sold, not what any individual home is worth.
How long does it take to sell a home in Hayward?
Homes that sold in August 2026 did so in a median of 16 days, and homes that went into contract during the month took a median of 15 days to get there. The homes still on the market at the end of August had been listed a median of 32 days, and they carried a median list price of $989,394 against $898,444 for the homes buyers signed on. Correctly priced homes are moving in about two weeks. Homes priced above where buyers are signing are waiting noticeably longer.
How many homes sold in Hayward in August 2026?
Forty three single-family homes closed in Hayward in August 2026, up 2.4% from July. Sixty seven new listings came on the market, 100 were active at month end, 44 went into contract during the month, and 43 were pending when the month closed. New contracts rose 10% while active listings fell 5.7%, so August absorbed homes faster than it added them.
Where can I get the full Hayward market report?
The complete report is available as a free printable PDF on this page. It includes every median price across the pipeline, the months-of-supply dial, the current-month supply and demand counts, and five-year context bands showing where August sits against the last five years. You can also reach me directly at (510) 600-3425 or homes@HarvRealtor.com for an address-specific opinion of value on your own home.
Your Local Real Estate Team

Harv Balu
REALTOR® | GRI, CIPS, PSA, FTBS · REALTY EXPERTS®
CA DRE# 02195792
REALTY EXPERTS® · 41051 Mission Blvd, Fremont, CA 94539