Union City, CA Real Estate Market Update | May 2026 | Strong Seller's Market, MAI 50
Strong Seller's Market, but with a flatter line than 2024. Here's what Union City's single-family market is doing this week, what the 5-year picture looks like, and what it means whether you're buying, selling, or just walking through this weekend's open house in Foothill Glen.
Union City single-family homes at a glance
Powered by Altos Research · Report dated May 2, 2026
Stasis at the seller-favorable line
Union City's MAI sits at 50, the same as last month. That's the lower edge of "Strong Seller's Market" territory. Inventory has crept up to 45 from earlier lows, but it's still tight enough to keep the market favoring sellers. Watch the MAI: a sustained move above 50 typically precedes upward price pressure; a move below 30 signals a balanced or buyer market.
Every metric, today
The four quartiles, ordered by price
Each bar represents 25% of the active Union City market.
Where today sits vs. the last five years
Today's values are exact and cited to the Altos report. Historical low/high are visual approximations from the report's 5-year trend charts (Sept 2021 to April 2026).
Median List Price
5-year rangeOff the 2024 to 2025 peak (~$1.55M area), but well above pandemic-era lows. Plateau persisting for several weeks.
Price per Square Foot
5-year rangeDrifting downward as larger homes come on the market. Buyers getting more home for the dollar. Not a sign of broad weakness.
Inventory (active listings)
5-year rangeClimbing toward the high end of the 5-year range. Watch with MAI. Rising inventory alone doesn't mean a softening market.
Market Action Index
5-year rangeOn the cooler side of the 5-year band, but still in seller-favorable territory. A sustained climb back above 60 would be the signal of fresh upward price pressure.
What the data is saying
Prices have plateaued. The median list price is $1,398,000, the same as last week, and within a fraction of a percent of last month. The 90-day median has been hovering on this plateau for several weeks, ever since the line came off its early 2025 highs.
Per-square-foot is drifting downward. $764/sq ft today, with the trend pointing softly down. This isn't a weakness signal on its own. It's typical when larger homes come on the market in larger numbers, which is exactly what's happening in the Top quartile (median 2,345 sq ft).
Inventory has crept up to 45. That's high relative to the past five years (the band ranged roughly 5 to 60), but the Market Action Index sat at 50 last month and is at 50 today. Translation: buyers are showing up at roughly the same pace inventory is. It's still seller-favorable, but the market is no longer running ahead of itself.
Days on market are split. Median 28 days, average 41. Half the active listings have come on in the past 28 days or so, meaning the freshest listings are moving in line with buyer activity, while a tail of older listings is dragging the average up.
What this means if you're buying
You have a little more room than you would have had a year ago. Inventory is on the higher side of the recent five-year range, and 24% of currently active listings have already had at least one price decrease. You don't have to be the first one through the door anymore. That said, the MAI is still in seller-favorable territory at 50, so well-priced, well-presented homes (particularly in the Lower-to-Mid quartiles, $1.29M to $1.45M range, 4-bed, ~1,500 to 1,650 sq ft) are still moving in under 35 days.
If your search is at the Top quartile ($1.6M+), you have meaningful negotiating leverage right now. DOM in that tier sits around 28 days but the average pulls higher; the band is the only quartile where price-cut percentages run materially above the city average.
What this means if you're selling
It's still your market, but momentum has slowed enough that pricing-right matters more than it did six months ago. The headline you want to internalize: prices have not been moving higher for several weeks. Pricing 3 to 5% above last comparable closing is no longer a reliable strategy; it's how listings end up in the 24% that drop price.
Two things still favor sellers in May 2026:
- Inventory is rising, but not flooding. 45 active listings is high for the five-year band, but Union City has only ever cracked 60 active listings briefly.
- Median DOM is 28 days. Properties that hit the market priced correctly are getting absorbed in under a month.
The play if you're listing in May: price within $10K to $15K of the closest verified comp, prep the home tightly, and lean on the first 14-day window. The MAI is at the floor of "Strong Seller's Market." Fast attention while it's still labeled that way is worth more than a higher list price that gets cut a month in.
Foothill Glen and the Governo open house this weekend
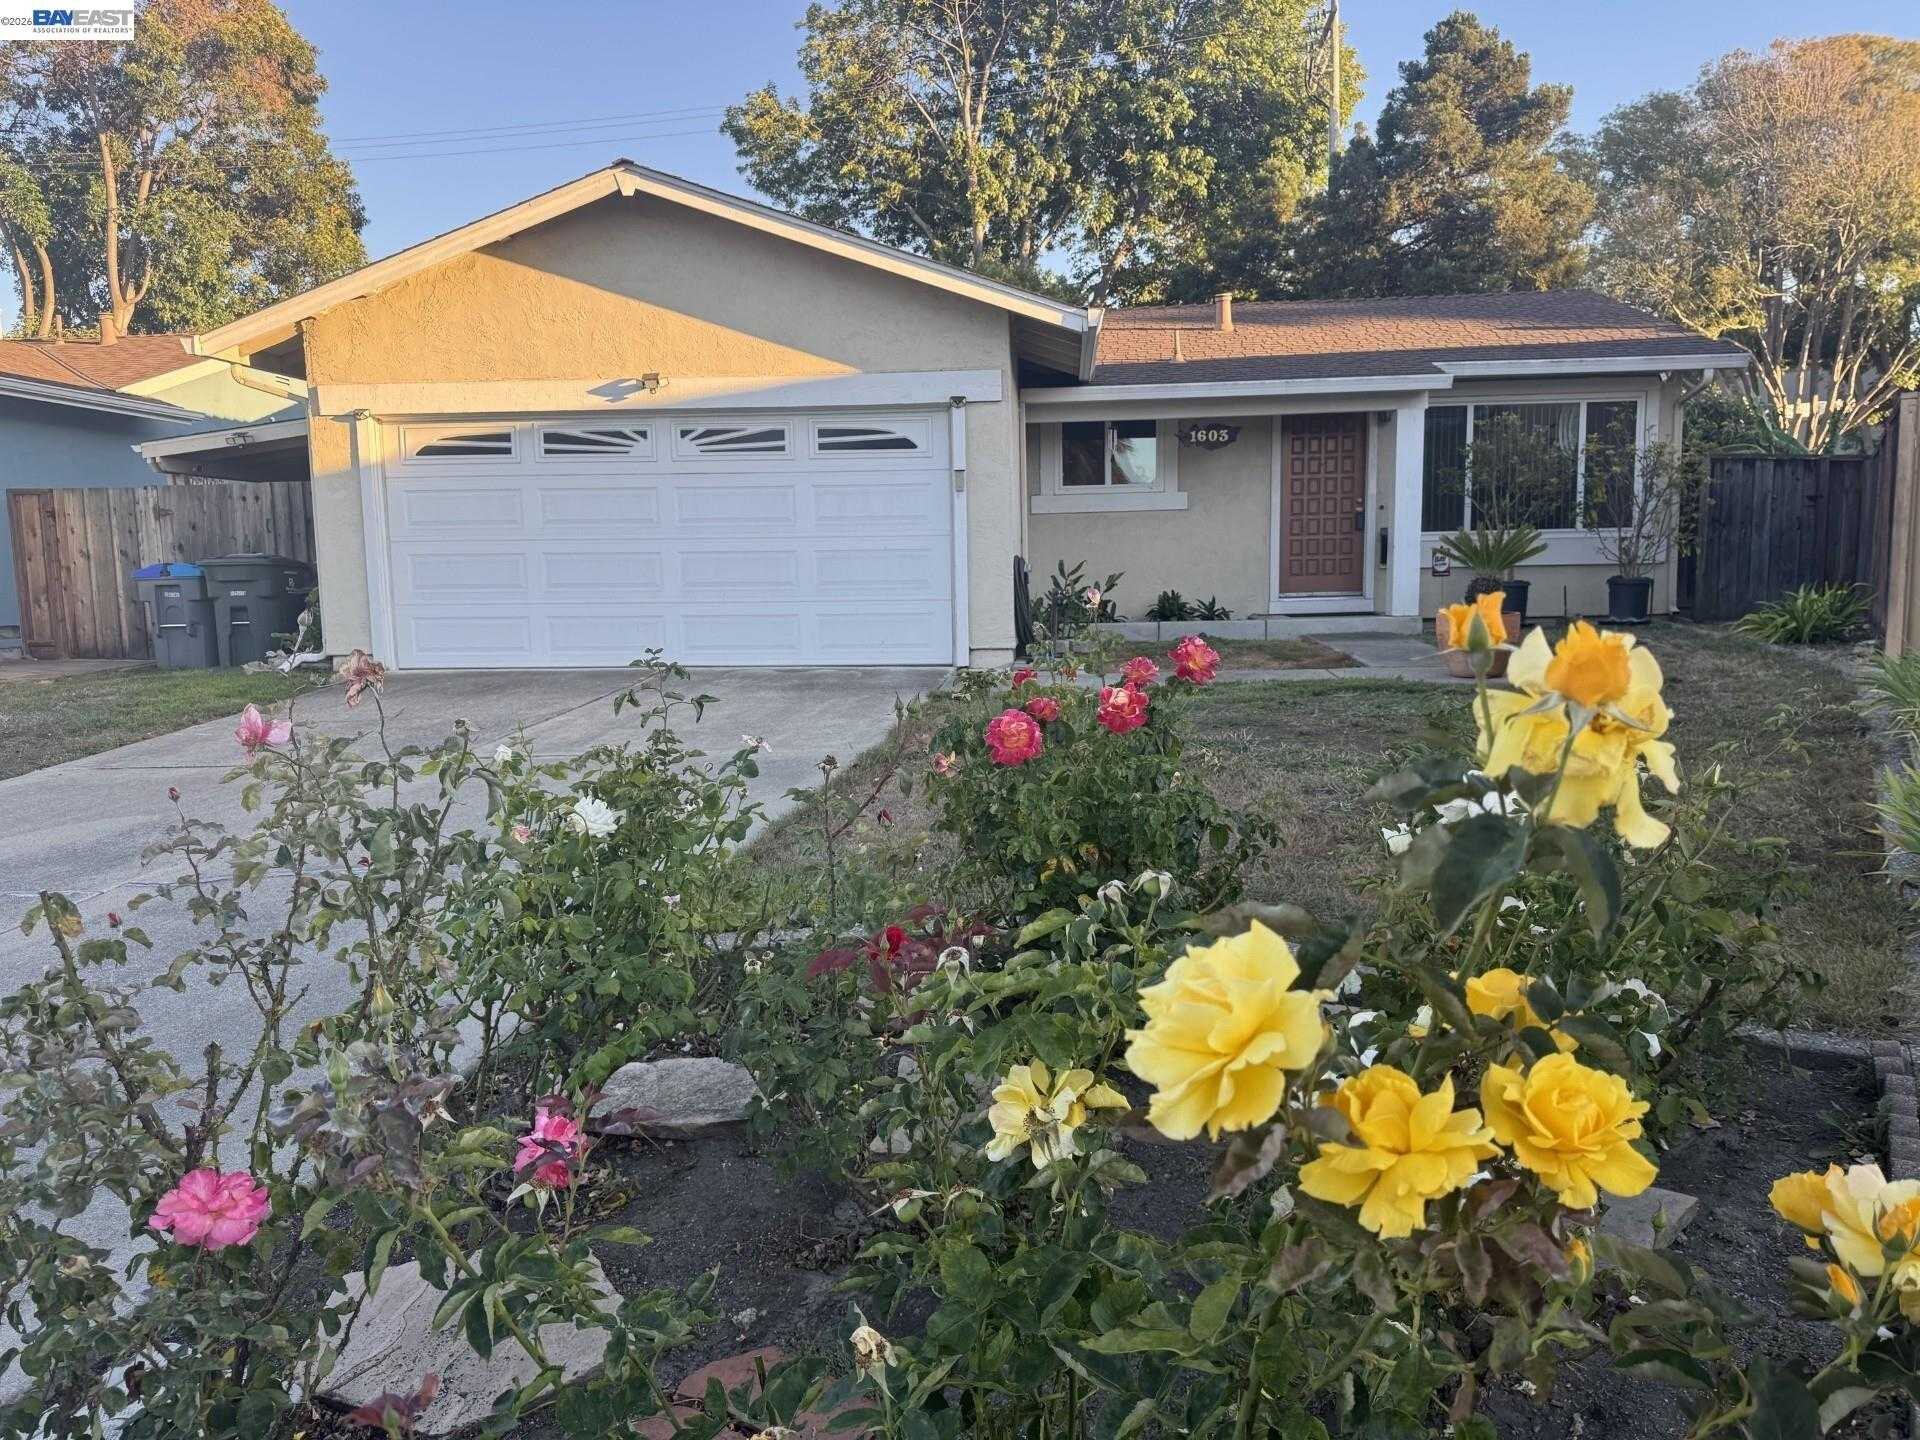
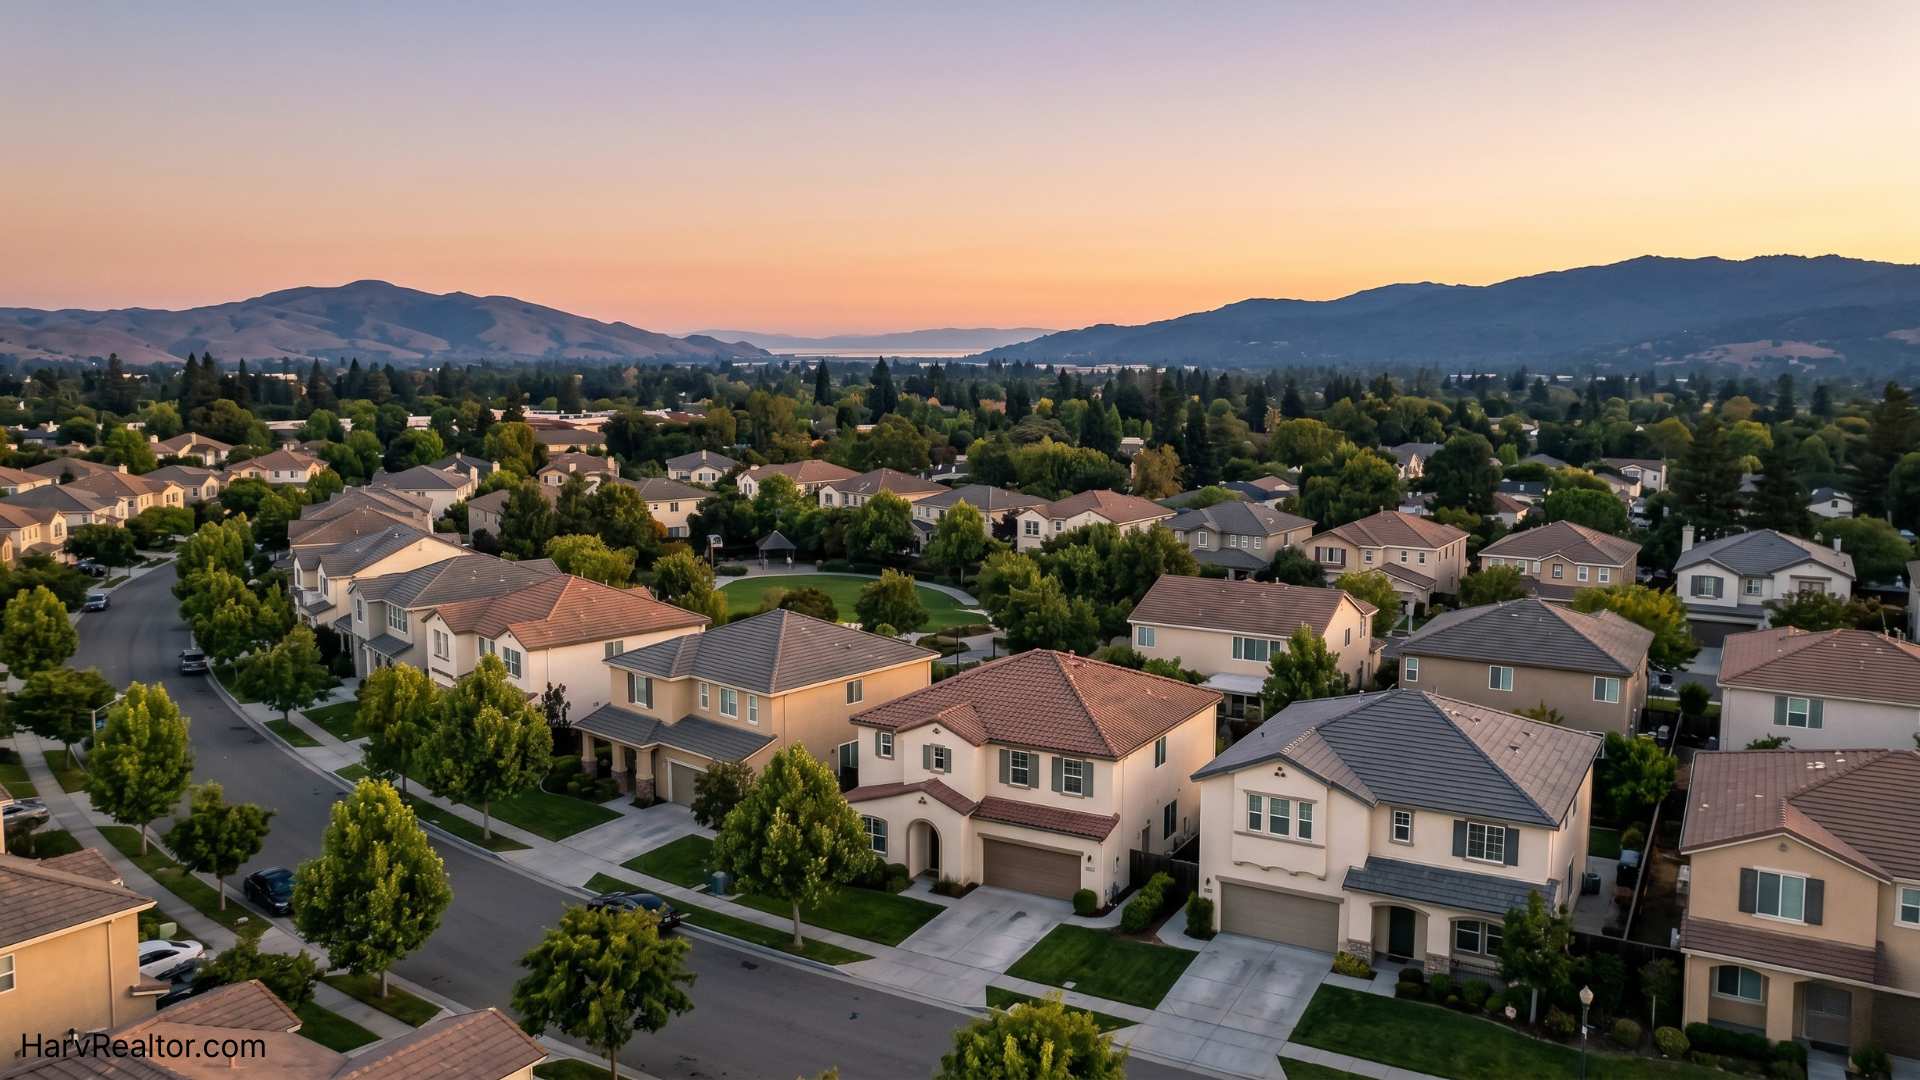
Foothill Glen is one of the more competitive sub-markets within Union City. Braddock & Logan-built, walking distance to BART, and on the higher end of the city's $/sqft range.
I'm hosting 34187 Governo Drive this Saturday and Sunday (May 2 & 3, 2026, 1 to 4 PM). A 4-bed, 2.5-bath Arbor Rose, 2,138 sq ft, listed at $1,498,000 ($701/sq ft). It's one of the more transparent buys in the current Union City inventory: priced about 9% below RVM® of $1,657,320, park-facing with no front neighbors, and it's the only Foothill Glen home open for inspection this weekend.
If the market data above interests you and you want to see what mid-quartile Union City inventory actually looks like, walk through. No appointment needed; just come by during open house hours.
Disclosures & Data Sources
Data Source. All market metrics in this post are sourced from the Altos Research Local Market Report for Union City, CA, Single-Family Homes, dated May 2, 2026. © 2026 Altos Research, Inc. (altos.re). Today's values are exact and cited to the report. Historical 5-year ranges shown in the dashboard are visual approximations of the report's trend charts (Sept 2021 to April 2026); they are intended to communicate range and direction, not to substitute for the underlying time-series data.
Not a Guarantee. Real estate market data reflects past and current conditions and is not a guarantee of future results. Median values describe the broader market and may not represent any individual property. For a property-specific analysis, contact me directly.
Listing & Compliance. Information deemed reliable but not guaranteed. Buyer to verify all data including but not limited to schools, square footage, lot size, and HOA. Equal Housing Opportunity.
Harv Balu, REALTOR® · GRI, CIPS, PSA, FTBS · DRE #02195792 · REALTY EXPERTS®, 41051 Mission Blvd, Fremont, CA 94539, Cell 510-600-3425, homes@HarvRealtor.com, HarvRealtor.com
Your Local Real Estate Team

Harv Balu
REALTOR® | GRI, CIPS, PSA, FTBS · REALTY EXPERTS®
CA DRE# 02195792
REALTY EXPERTS® · 41051 Mission Blvd, Fremont, CA 94539